Trong IELTS Writing Task 1, bạn sẽ phân tích biểu đồ Bar Chart so sánh số giờ làm việc trung bình của nhân viên trong 3 tháng của ba công ty khác nhau. Biểu đồ sẽ cho thấy số giờ làm việc trung bình hàng tháng của từng công ty qua 3 tháng, cung cấp một cái nhìn tổng quan về sự khác biệt và xu hướng của từng công ty trong thời gian đó.
Đọc bài này Cách làm bài IELTS Writing Task 1 Bar Chart trước khi làm bài.
Bạn cũng có thể đọc lại bài nói về Task 1 tại đây: IELTS Writing Task 1 cần lưu ý những gì?
IELTS Writing Task 1 Bar Chart: Working Hours
You should spent about 20 mintutes on this task
In IELTS Writing Task 1, you will analyze a Bar Chart comparing the average working hours of employees over three months in three different companies. The chart will illustrate the average monthly working hours for each company across the three months, providing an overview of differences and trends within that period.
You should write at least 150 words.
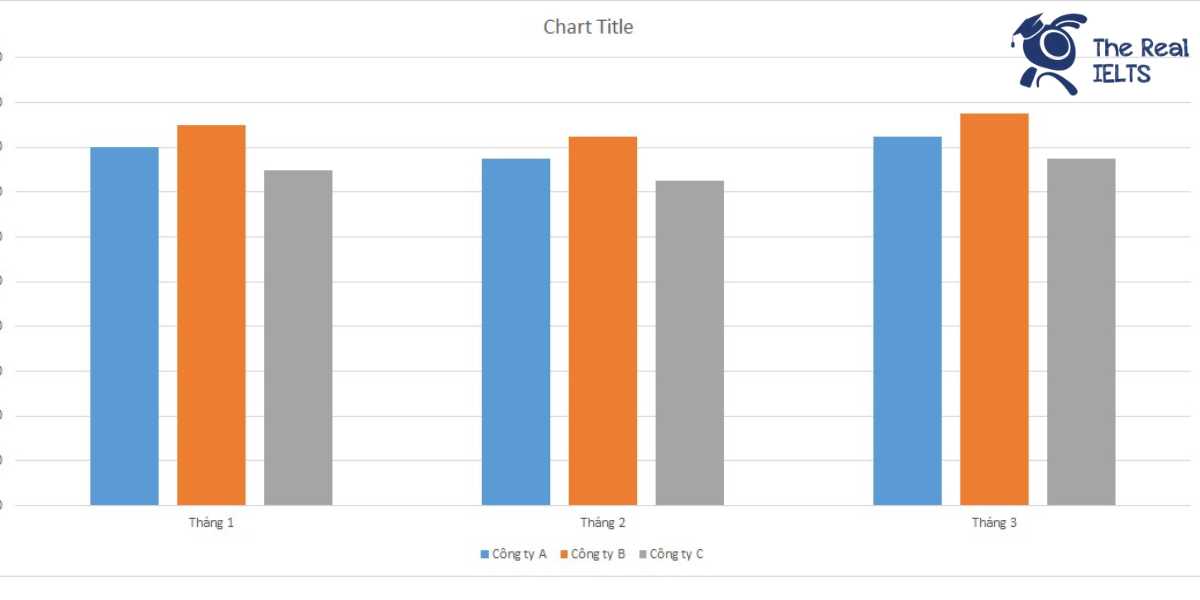
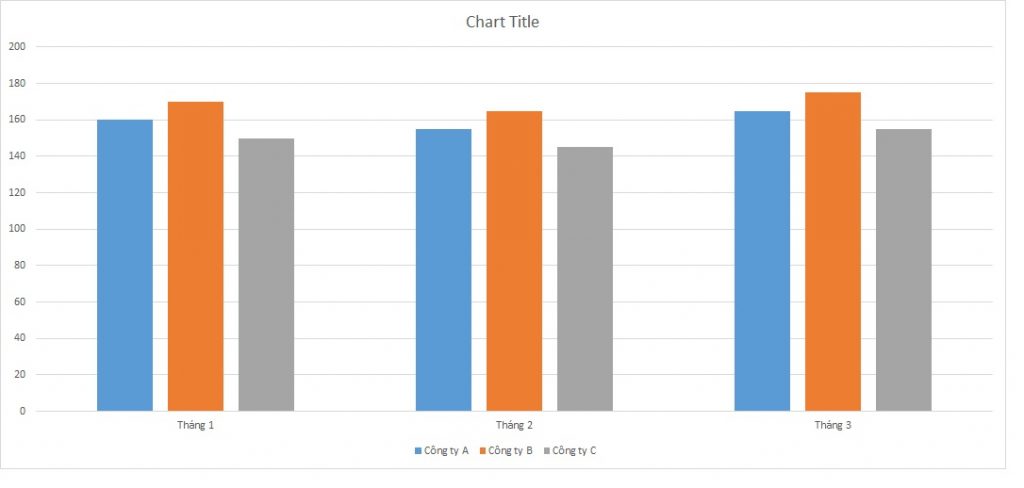
| Tháng | Công ty A | Công ty B | Công ty C |
| Tháng 1 | 160 giờ | 170 giờ | 150 giờ |
| Tháng 2 | 155 giờ | 165 giờ | 145 giờ |
| Tháng 3 | 165 giờ | 175 giờ | 155 giờ |
Bài mẫu 1
Introduction
The table provides information on the number of working hours recorded by employees in three different companies (A, B, and C) over a span of three months (January, February, and March).
Overview
Overall, it is evident that Company B consistently had the highest number of working hours each month, whereas Company C consistently had the lowest. The working hours for all three companies show some fluctuations over the three-month period.
Body 1
In January, employees of Company B worked the most, clocking in at 170 hours, followed by Company A with 160 hours, and Company C with 150 hours. The pattern remained similar in February, with Company B employees working 165 hours, Company A employees working 155 hours, and Company C employees working 145 hours.
Body 2
March saw an increase in working hours across all three companies. Company B again led with 175 hours, showing a rise of 10 hours from February. Company A followed with 165 hours, a 10-hour increase compared to February. Company C recorded 155 hours in March, which was also an increase of 10 hours from the previous month.
In summary, Company B consistently maintained the highest number of working hours, while Company C had the lowest. The number of working hours for all companies increased in March compared to January and February.
Bài mẫu 2
The table illustrates the number of working hours of employees in three companies, namely Company A, Company B, and Company C, over a three-month period (January, February, and March).
Overall, Company B consistently had the highest number of working hours each month, while Company C had the lowest. Company A’s working hours fluctuated, generally falling between those of Company B and Company C.
In January, employees at Company B worked the most, totaling 170 hours, followed by Company A with 160 hours, and Company C with 150 hours. In February, there was a slight decline in working hours across all companies. Company B’s employees worked 165 hours, while Company A and Company C recorded 155 hours and 145 hours, respectively.
By March, an increase in working hours was observed for all companies. Company B continued to lead with 175 hours, Company A increased to 165 hours, and Company C to 155 hours.
In summary, Company B had the highest working hours consistently over the three months, while Company C had the least. Company A’s working hours were moderate, showing a slight increase from February to March.
Bài mẫu 3
Introduction
The table illustrates the number of hours worked by employees in three different companies, labeled as Company A, Company B, and Company C, over a period of three months: January, February, and March.
Overview
Overall, Company B consistently had the highest number of hours worked each month, while Company C had the lowest. There were fluctuations in the hours worked across all three companies over the three-month period.
Body 1
In January, employees at Company A worked a total of 160 hours, while those at Company B and Company C worked 170 hours and 150 hours respectively. Moving into February, there was a slight decrease in the number of hours worked across all companies. Company A’s hours dropped to 155, Company B’s to 165, and Company C’s to 145.
Body 2
In March, the number of hours worked increased for all three companies compared to February. Company A’s employees worked 165 hours, Company B’s employees worked the most at 175 hours, and Company C’s employees worked 155 hours. This month saw the highest number of hours worked by employees in Company B throughout the three-month period.