IELTS Writing Task 1 yêu cầu thí sinh miêu tả tỷ lệ chấm công trong ba tháng của ba công ty được biểu diễn bằng biểu đồ Bar Chart. Thí sinh cần phân tích số liệu, so sánh xu hướng và nêu bật sự khác biệt hoặc tương đồng giữa các công ty. Kỹ năng viết mô tả và phân tích số liệu là rất quan trọng.
Đọc bài này Cách làm bài IELTS Writing Task 1 Bar Chart trước khi làm bài.
Bạn cũng có thể đọc lại bài nói về Task 1 tại đây: IELTS Writing Task 1 cần lưu ý những gì?
Đọc thêm về xây dựng lộ trình học IELTS của The Real IELTS.
IELTS Writing Task 1 Bar Chart: Attendance Rates
You should spent about 20 mintutes on this task
IELTS Writing Task 1 requires candidates to describe the attendance rates over three months for three companies, represented by a Bar Chart. Candidates need to analyze the data, compare trends, and highlight differences or similarities between the companies. Descriptive writing and data analysis skills are essential.
You should write at least 150 words
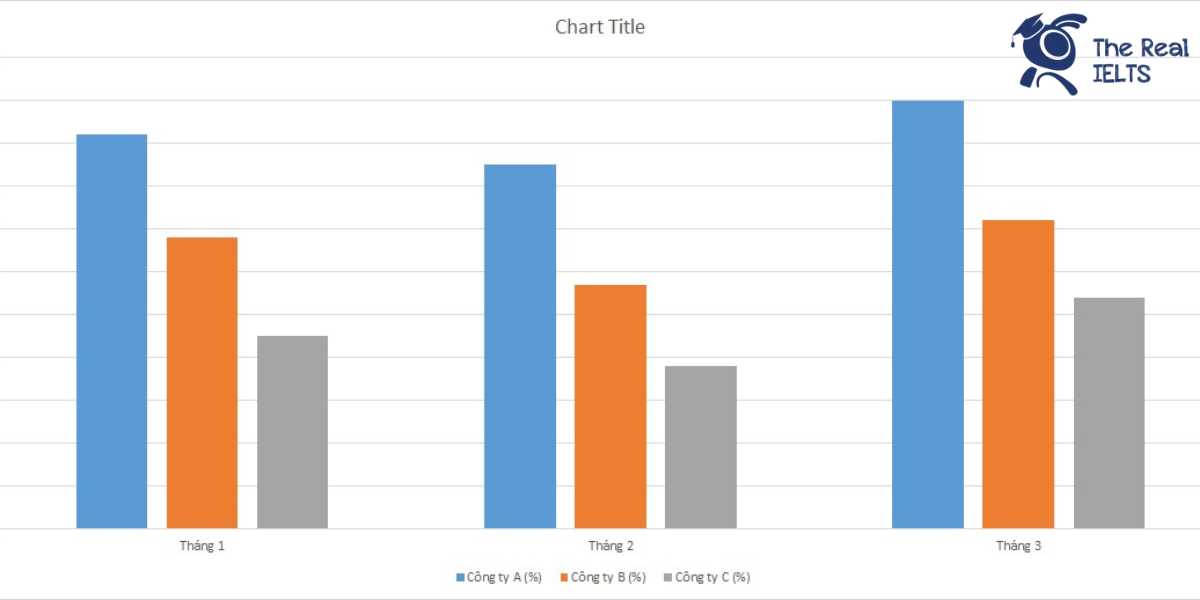
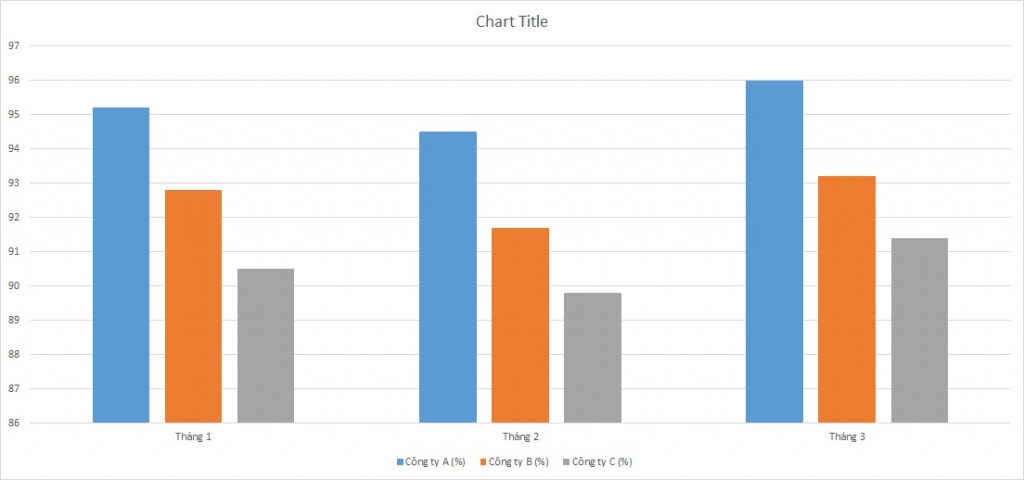
| Tháng | Công ty A (%) | Công ty B (%) | Công ty C (%) |
| Tháng 1 | 95.2 | 92.8 | 90.5 |
| Tháng 2 | 94.5 | 91.7 | 89.8 |
| Tháng 3 | 96 | 93.2 | 91.4 |
Bài mẫu 1
Introduction
The table provides data on the attendance rates of three companies (A, B, and C) over a three-month period.
Overview
Overall, Company A consistently had the highest attendance rates, while Company C had the lowest. The attendance rates for all three companies showed slight fluctuations over the three months.
Body 1
In January, Company A had the highest attendance rate at 95.2%, followed by Company B at 92.8%, and Company C at 90.5%. In February, there was a slight decline in attendance for all three companies, with Company A dropping to 94.5%, Company B to 91.7%, and Company C to 89.8%.
Body 2
March saw an improvement in attendance rates for all three companies. Company A’s attendance rose to 96.0%, making it the highest rate recorded in the three months. Company B also experienced an increase, reaching 93.2%, while Company C’s attendance improved to 91.4%.
In conclusion, Company A maintained the highest attendance rates throughout the period, while Company C had the lowest. The attendance rates for all three companies showed minor variations month-to-month.
Bài mẫu 2
Introduction
The table illustrates the attendance rates of three companies (Company A, Company B, and Company C) over a period of three months (January, February, and March).
Overview
Overall, Company A consistently had the highest attendance rates each month, while Company C had the lowest. The attendance rates for all companies showed slight fluctuations over the three months.
Body 1
In January, Company A recorded the highest attendance rate at 95.2%, followed by Company B at 92.8%, and Company C at 90.5%. In February, the attendance rates for all companies decreased slightly. Company A dropped to 94.5%, Company B to 91.7%, and Company C to 89.8%, maintaining the same rank among the companies.
Body 2
In March, all three companies saw an increase in attendance rates. Company A had the highest increase, reaching 96.0%, which is the highest rate observed over the three months. Company B’s attendance rate increased to 93.2%, and Company C improved to 91.4%. Despite these fluctuations, the ranking of the companies based on attendance rates remained consistent throughout the period.
In summary, Company A maintained the highest attendance rate across the three months, with Company B and Company C following respectively.