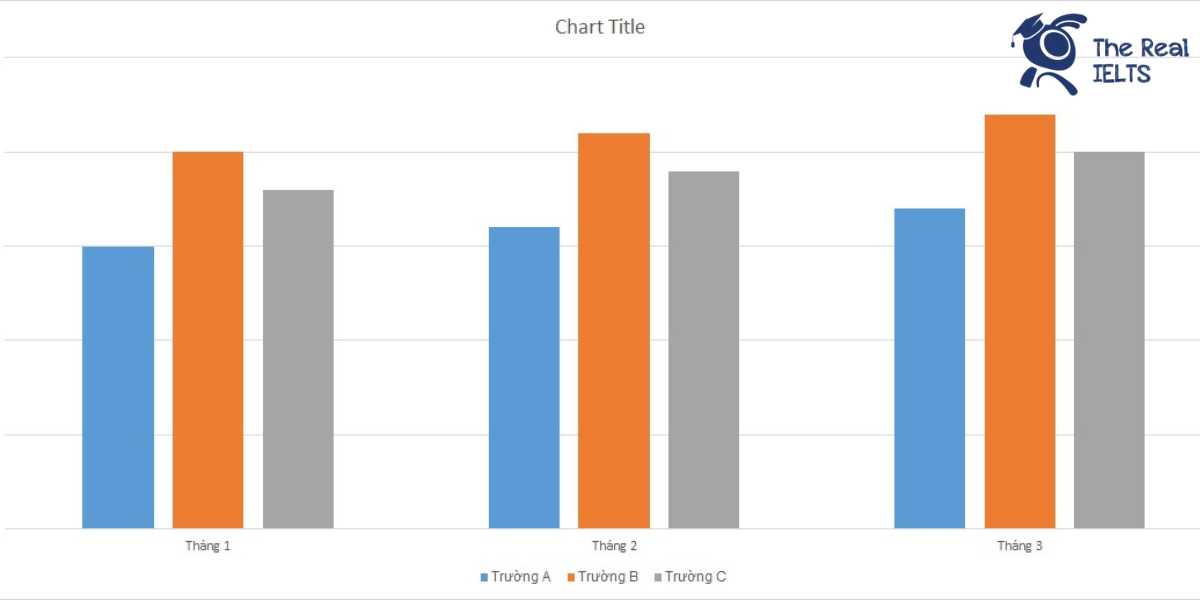
IELTS Writing Task 1 yêu cầu mô tả Bar Chart về số lượng học sinh tham gia ngoại khóa trong ba tháng tại ba trường học. Đồ thị hiển thị rõ ràng sự thay đổi số lượng học sinh qua từng tháng và so sánh giữa các trường, giúp đánh giá mức độ tham gia của học sinh trong các hoạt động ngoại khóa.
Đọc bài này Cách làm bài IELTS Writing Task 1 Bar Chart trước khi làm bài.
Bạn cũng có thể đọc lại bài nói về Task 1 tại đây: IELTS Writing Task 1 cần lưu ý những gì?
Đọc thêm về xây dựng lộ trình học IELTS của The Real IELTS.
IELTS Writing Task 1 Bar Chart: Students Participating
You should spent about 20 mintutes on this task
IELTS Writing Task 1 requires describing a Bar Chart about the number of students participating in extracurricular activities over three months at three schools. The chart clearly shows the changes in the number of students each month and compares the schools, helping to assess the level of student participation in extracurricular activities.
You should write at least 150 words
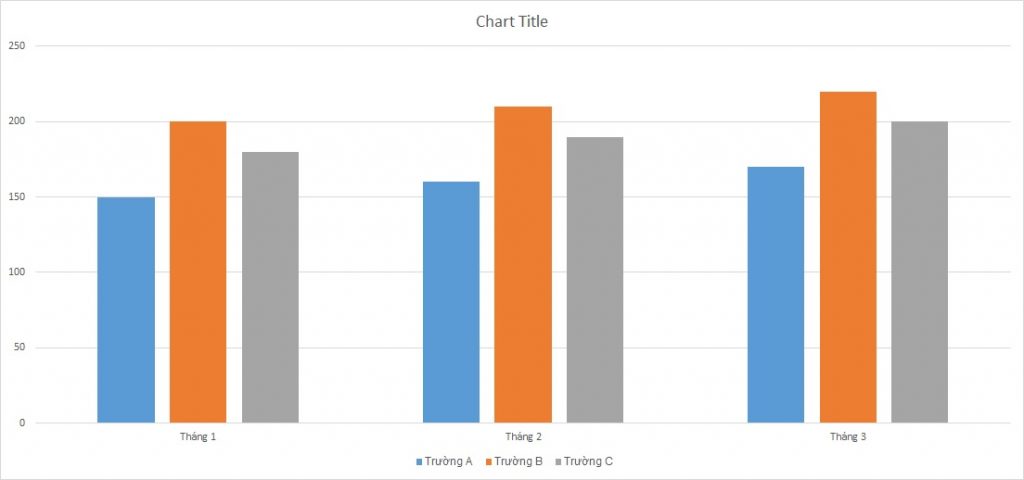
| Tháng | Trường A | Trường B | Trường C |
| Tháng 1 | 150 | 200 | 180 |
| Tháng 2 | 160 | 210 | 190 |
| Tháng 3 | 170 | 220 | 200 |
Bài mẫu 1
Introduction
The table illustrates the number of students participating in extracurricular activities over three months from January to March in three different schools: School A, School B, and School C.
Overview
Overall, the number of students involved in extracurricular activities increased in all three schools over the three-month period. School B consistently had the highest participation rates, while School A had the lowest.
Body 1
In January, School A had 150 students participating, which was the lowest among the three schools. School B had the highest number of participants at 200 students, while School C had 180 students. In February, the number of participants increased slightly in all three schools. School A saw an increase to 160 students, School B to 210 students, and School C to 190 students.
Body 2
By March, the number of students participating in extracurricular activities continued to rise. School A had 170 students, School B had 220 students, and School C had 200 students. This steady increase in participation across all three schools suggests a growing interest in extracurricular activities over the observed period.
Overall, the data indicates a positive trend in student engagement in extracurricular activities, with School B consistently leading in the number of participants each month.
Bài mẫu 2
Introduction
The table illustrates the number of students participating in extracurricular activities over a three-month period in three schools: School A, School B, and School C.
Overview
Overall, the number of students participating in extracurricular activities increased consistently across all three schools from January to March. School B had the highest number of participants each month, while School A had the lowest.
Body 1
In January, School B had the highest number of participants with 200 students, followed by School C with 180 students, and School A with 150 students. In February, all three schools saw an increase in participation. School B still led with 210 students, an increase of 10 students from the previous month. School C followed with 190 students, increasing by 10 students, and School A had 160 students, showing an increase of 10 students.
Body 2
In March, the trend of increasing participation continued. School B reached 220 students, adding another 10 students from February. School C had 200 participants, with an increase of 10 students, while School A saw an increase to 170 students, maintaining a consistent rise of 10 students each month. This consistent upward trend indicates a growing interest in extracurricular activities among students across all three schools.
Conclusion
In conclusion, the number of students participating in extracurricular activities steadily increased in all three schools over the three-month period, with School B consistently having the highest number of participants, followed by School C, and School A having the least.