IELTS Writing Task 1 yêu cầu bạn phân tích biểu đồ cột về tỷ lệ tử vong do tai nạn giao thông trong 3 ngày tại 3 khu vực trong thành phố. Bạn sẽ mô tả số liệu, so sánh các khu vực, và rút ra nhận xét chính. Chú ý đến các biến động trong tỷ lệ tử vong và so sánh sự thay đổi giữa các khu vực để cung cấp một bức tranh toàn diện về tình hình giao thông tại địa phương.
Đọc bài này Cách làm bài IELTS Writing Task 1 Bar Chart trước khi làm bài.
Bạn cũng có thể đọc lại bài nói về Task 1 tại đây: IELTS Writing Task 1 cần lưu ý những gì?
Đọc thêm về xây dựng lộ trình học IELTS của The Real IELTS.
IELTS Writing Task 1 Bar Chart: Mortality Rate
You should spent about 20 mintutes on this task
IELTS Writing Task 1 requires you to analyze a bar chart about the mortality rate from traffic accidents over 3 days in 3 areas within the city. You will describe the data, compare the areas, and draw key observations. Pay attention to fluctuations in the mortality rate and compare the changes between the areas to provide a comprehensive picture of the local traffic situation.
You should write at least 150 words.
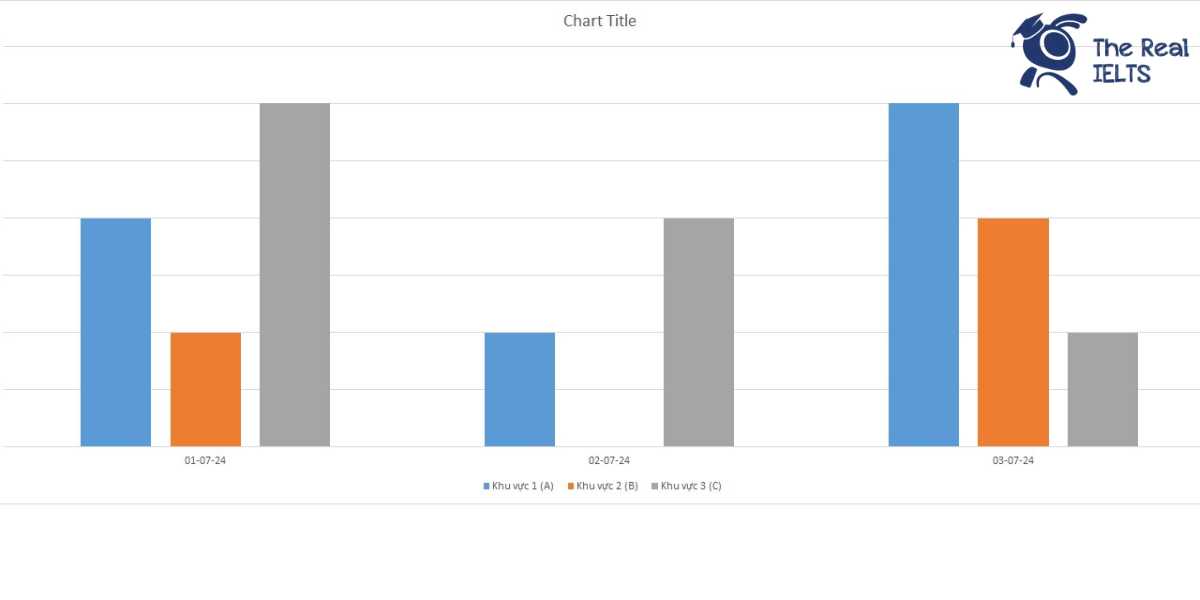
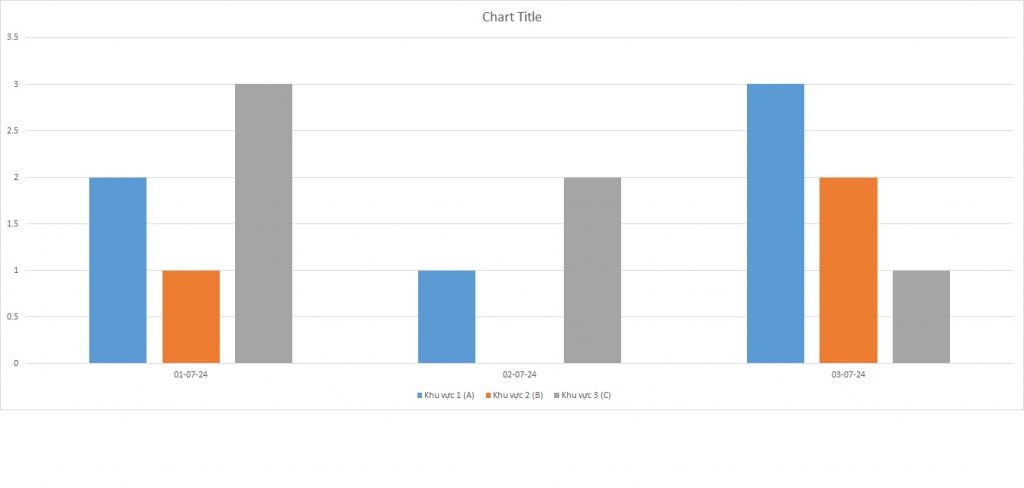
| Ngày | Khu vực 1 (A) | Khu vực 2 (B) | Khu vực 3 (C) |
| 01/07/2024 | 2 | 1 | 3 |
| 02/07/2024 | 1 | 0 | 2 |
| 03/07/2024 | 3 | 2 | 1 |
IELTS Writing mẫu 1
Overview
Traffic accidents are a significant concern in urban areas, leading to fatalities and serious injuries. This report analyzes the mortality rates due to traffic accidents over three days in three different areas of a city. The data provided highlights the variations in accident fatalities across these regions, offering insights into possible patterns and areas that may require targeted interventions.
Body 1
On July 1st, 2024, the three areas reported the following fatalities due to traffic accidents: Area A had 2 fatalities, Area B had 1 fatality, and Area C had 3 fatalities. This data indicates that Area C had the highest number of fatalities on this day, possibly suggesting higher traffic density or more hazardous conditions compared to Areas A and B. The lower fatality rate in Area B suggests either better traffic management or fewer incidents occurring in that area.
Body 2
The following day, July 2nd, 2024, saw a decrease in fatalities across the board. Area A reported 1 fatality, Area B reported no fatalities, and Area C reported 2 fatalities. This downward trend in Area A and the absence of fatalities in Area B might reflect temporary improvements in traffic safety measures or simply a less active traffic day. However, Area C still had 2 fatalities, which, although lower than the previous day, remains concerning.
On July 3rd, 2024, the fatality rates showed an increase again. Area A reported 3 fatalities, the highest for this area over the three days. Area B reported 2 fatalities, and Area C reported 1 fatality. This data suggests that while Area C saw an improvement, Areas A and B experienced a rise in fatalities, highlighting the unpredictable nature of traffic accidents and the need for consistent safety measures.
Conclusion
The analysis over the three-day period reveals fluctuating fatality rates due to traffic accidents in the three areas. Area C consistently showed higher fatalities initially but improved by the third day, whereas Areas A and B exhibited a varied pattern. These insights underscore the necessity for ongoing evaluation and enhancement of traffic safety strategies to reduce fatalities and improve road safety across all areas.
IELTS Writing 2
Overview
The table below presents a hypothetical set of data showing the mortality rates from traffic accidents over three days in three different areas of a city. This analysis will provide an insight into the varying levels of traffic safety in these areas.
Body 1
Data Summary
The data provided is as follows.
On the first day, 1st July 2024, Area 3 recorded the highest number of fatalities with three deaths, while Area 2 had the lowest with one death. On the second day, Area 1 experienced one fatality, and Area 2 reported no fatalities, while Area 3 saw two fatalities. On the third day, Area 1 had the highest number of fatalities with three, followed by Area 2 with two, and Area 3 had the lowest with one.
Body 2
Analysis
From this data, a few key points can be observed. First, Area 3 had a notably high number of fatalities on the first day but saw a significant decrease by the third day. Area 1’s fatality numbers fluctuated, peaking on the third day. Area 2 consistently had the lowest fatalities, with zero fatalities reported on the second day.
This variation could be due to several factors, such as traffic density, road conditions, or the presence of safety measures in each area. The decrease in fatalities in Area 3 might indicate improved safety measures or reduced traffic. Conversely, the increase in Area 1’s fatalities on the third day suggests a potential rise in traffic or a lapse in safety protocols.
In conclusion, this data highlights the importance of continuous monitoring and improvement of traffic safety measures across all areas to reduce the number of traffic-related fatalities.