IELTS Writing Task 1 Bar Chart: Paper Consumption. Biểu đồ cột mô tả lượng tiêu thụ giấy vệ sinh trong ba tháng của ba tòa nhà khác nhau. Theo biểu đồ, lượng tiêu thụ của từng tòa nhà thay đổi theo thời gian, cho thấy sự khác biệt trong nhu cầu và thói quen sử dụng giấy vệ sinh giữa các tòa nhà.
Đọc bài này Cách làm bài IELTS Writing Task 1 Bar Chart trước khi làm bài.
Bạn cũng có thể đọc lại bài nói về Task 1 tại đây: IELTS Writing Task 1 cần lưu ý những gì?
Đọc thêm về xây dựng lộ trình học IELTS của The Real IELTS.
IELTS Writing Task 1 Bar Chart: Paper Consumption
You should spent about 20 mintutes on this task
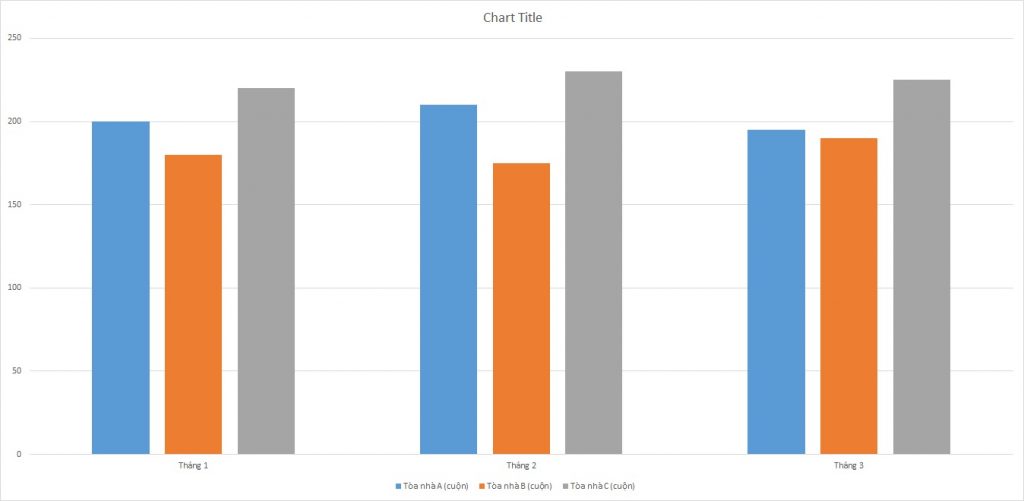
The bar chart illustrates the toilet paper consumption over three months for three different buildings. According to the chart, the consumption levels for each building vary over time, indicating differences in toilet paper needs and usage habits among the buildings.
You should write at least 150 words.
| Tháng | Tòa nhà A (cuộn) | Tòa nhà B (cuộn) | Tòa nhà C (cuộn) |
| Tháng 1 | 200 | 180 | 220 |
| Tháng 2 | 210 | 175 | 230 |
| Tháng 3 | 195 | 190 | 225 |
Bài mẫu số 1
Overview
The consumption of toilet paper across three different buildings was monitored over a period of three months. The data reflects the number of toilet paper rolls used in Buildings A, B, and C during January, February, and March. This analysis aims to compare and contrast the usage patterns in these buildings, providing insights into their sanitation needs and potentially informing future procurement decisions.
Body 1: Building A
In Building A, the consumption of toilet paper showed some fluctuation over the three months. In January, Building A used 200 rolls, which increased to 210 rolls in February. However, in March, there was a slight decrease, with the usage dropping to 195 rolls. This pattern suggests that while there was a peak in February, the overall usage remained relatively stable, indicating a consistent demand with minor variations.
Body 2: Buildings B and C
Building B displayed a different trend compared to Building A. In January, the building used 180 rolls of toilet paper, which then decreased to 175 rolls in February. However, in March, the consumption increased to 190 rolls, indicating a rise in demand towards the end of the period. On the other hand, Building C had the highest and most consistent usage among the three buildings. In January, it used 220 rolls, which increased to 230 rolls in February. By March, the usage slightly decreased to 225 rolls, but it still remained higher than the consumption in Buildings A and B throughout the period.
Conclusion
Overall, Building C had the highest toilet paper consumption, indicating a higher usage rate or larger population compared to Buildings A and B. Building A showed a steady pattern with a peak in February, while Building B had a more variable pattern with the lowest consumption in February and a significant increase in March. These insights can help facility managers plan better for their toilet paper supplies to meet the demands of each building effectively.
Bài mẫu 2
Overview
The consumption of toilet paper over three months in three different buildings (Building A, Building B, and Building C) shows varying usage patterns. This statistical analysis aims to provide insights into the monthly consumption trends and compare the usage among these buildings.
Body 1
In January, Building C had the highest consumption with 220 rolls, followed by Building A with 200 rolls, and Building B with the lowest at 180 rolls. This suggests that Building C had either a higher occupancy or greater usage per person compared to the other buildings.
In February, there was a noticeable increase in the consumption for Buildings A and C, with 210 and 230 rolls respectively, while Building B saw a slight decrease to 175 rolls. This increase in Buildings A and C could indicate higher occupancy or increased activities requiring more toilet paper.
Body 2
March saw a different trend with Building B showing a significant increase in consumption to 190 rolls, which is higher than its previous months. Building A experienced a slight decrease to 195 rolls, and Building C also showed a reduction to 225 rolls. This suggests a possible redistribution of occupants or a change in usage habits.
Overall, Building C consistently had the highest consumption over the three months, indicating either higher usage needs or more occupants, while Building B had the lowest, except for a rise in March. These trends are crucial for managing supply and understanding usage patterns across different buildings.