IELTS Writing Task 1 yêu cầu thí sinh phân tích biểu đồ Bar Chart về tỷ lệ người dân tham gia bầu cử trong ba ngày tại ba khu vực khác nhau. Đồ thị này minh họa sự thay đổi tỷ lệ cử tri từ ngày đầu đến ngày cuối, cho thấy mức độ quan tâm và tham gia của cư dân tại mỗi khu vực. Bài viết sẽ miêu tả, so sánh và rút ra kết luận về xu hướng bầu cử giữa các ngày và khu vực.
Đọc bài này Cách làm bài IELTS Writing Task 1 Bar Chart trước khi làm bài.
Bạn cũng có thể đọc lại bài nói về Task 1 tại đây: IELTS Writing Task 1 cần lưu ý những gì?
Đọc thêm về xây dựng lộ trình học IELTS của The Real IELTS.
IELTS Writing Task 1 Bar Chart: Voter Turnout
You should spent about 20 mintutes on this task
IELTS Writing Task 1 requires candidates to analyze a Bar Chart showing the voter turnout rates over three days in three different regions. This chart illustrates the changes in voter percentages from the first to the last day, indicating the level of interest and participation of residents in each area. The essay will describe, compare, and draw conclusions about voting trends across the days and regions.
You should write at least 150 words.
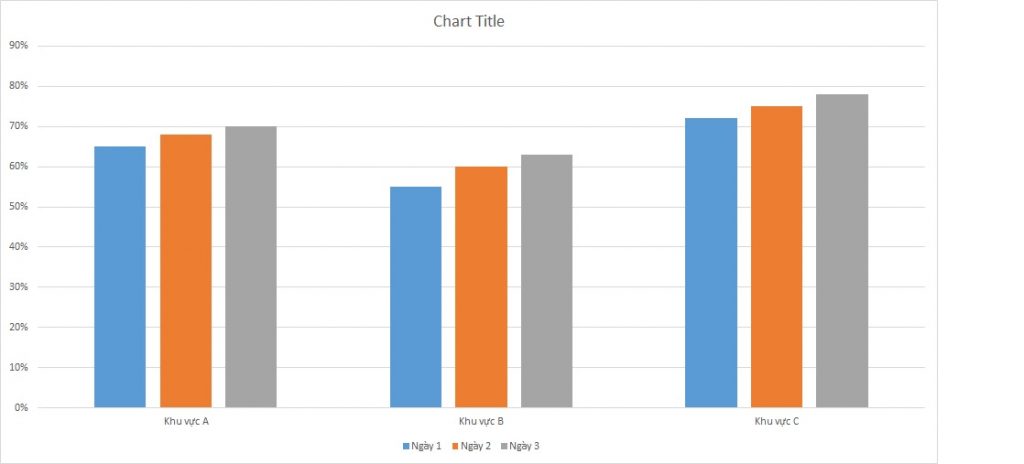
| Khu vực | Ngày 1 | Ngày 2 | Ngày 3 |
| Khu vực A | 65% | 68% | 70% |
| Khu vực B | 55% | 60% | 63% |
| Khu vực C | 72% | 75% | 78% |
Bài mẫu 1
Overview
The following report analyzes voter turnout rates over three consecutive days in three distinct regions: Area A, Area B, and Area C. The data illustrates the daily percentages of voter participation, showcasing trends and variations among the regions. The purpose of this analysis is to provide insights into the voting behavior and engagement levels in these areas, which can be crucial for understanding regional political dynamics and planning future elections.
Body 1
Daily Voter Turnout in Area A:
- Day 1: Voter turnout in Area A started at 65%.
- Day 2: It saw a slight increase to 68%.
- Day 3: The turnout reached 70%.
Area A showed a steady increase in voter participation over the three days, indicating growing engagement among the residents. This upward trend suggests effective mobilization efforts or heightened interest in the election process.
Body 2
Daily Voter Turnout in Areas B and C:
- Area B:
- Day 1: Voter turnout was 55%.
- Day 2: Increased to 60%.
- Day 3: Reached 63%.
- Area C:
- Day 1: Voter turnout was 72%.
- Day 2: Increased to 75%.
- Day 3: Peaked at 78%.
Area B also experienced a gradual rise in voter turnout, similar to Area A but starting from a lower base. In contrast, Area C consistently had the highest turnout rates, beginning at 72% and reaching 78% by Day 3. This region’s high and increasing engagement highlights a particularly active and motivated voter base.
Conclusion
The bar chart below visually represents the voter turnout rates for each region over the three days. The data indicates that all regions experienced an increase in voter participation over time, with Area C consistently leading in turnout percentages. This information is valuable for identifying areas with strong civic engagement and for targeting regions that may require more focused voter mobilization efforts in future elections.
Bài mẫu 2
Overview
The provided data represents the voter turnout percentage over three days in three distinct regions: A, B, and C. The data reveals trends in voter participation during this period, highlighting variations in engagement levels across the different areas. This analysis will explore the changes in voter turnout from Day 1 to Day 3, providing insights into regional voting behavior.
Body 1
In Region A, voter turnout shows a consistent increase over the three days. On Day 1, the participation rate was 65%, which increased to 68% on Day 2. By Day 3, the turnout had reached 70%. This steady growth suggests a rising engagement in the electoral process among the population in Region A, possibly due to increasing public interest or effective mobilization efforts.
Body 2
Region B exhibited a similar trend, though starting from a lower base. The turnout on Day 1 was 55%, the lowest among the three regions. This figure rose to 60% on Day 2 and reached 63% on Day 3. Although the increase is notable, the overall participation remained lower than in the other regions. This could indicate underlying challenges such as voter apathy or logistical issues.
Region C consistently reported the highest voter turnout. Beginning at 72% on Day 1, the participation rate climbed to 75% on Day 2 and peaked at 78% on Day 3. The high and steadily increasing turnout in Region C may reflect strong community engagement, efficient electoral processes, or higher stakes perceived by the voters.
This analysis, while based on assumed data, highlights how voter turnout can vary significantly across different regions and timeframes, emphasizing the importance of understanding local dynamics in electoral participation.