IELTS Writing Task 1 yêu cầu mô tả biểu đồ Bar Chart thể hiện số lượng sự kiện tổ chức trong ba tháng tại ba quốc gia. Thí sinh cần phân tích số liệu, so sánh số lượng sự kiện giữa các quốc gia và các tháng, đồng thời nêu bật những xu hướng chính và điểm khác biệt đáng chú ý. Bài viết nên logic, rõ ràng, và mạch lạc.
Đọc bài này Cách làm bài IELTS Writing Task 1 Bar Chart trước khi làm bài.
Bạn cũng có thể đọc lại bài nói về Task 1 tại đây: IELTS Writing Task 1 cần lưu ý những gì?
Đọc thêm về xây dựng lộ trình học IELTS của The Real IELTS.
IELTS Writing Task 1 Bar Chart: Events
You should spent about 20 mintutes on this task
IELTS Writing Task 1 requires describing a Bar Chart showing the number of events organized over three months in three countries. Candidates need to analyze the data, compare the number of events between countries and months, and highlight the main trends and notable differences. The essay should be logical, clear, and coherent.
You should write at least 150 words
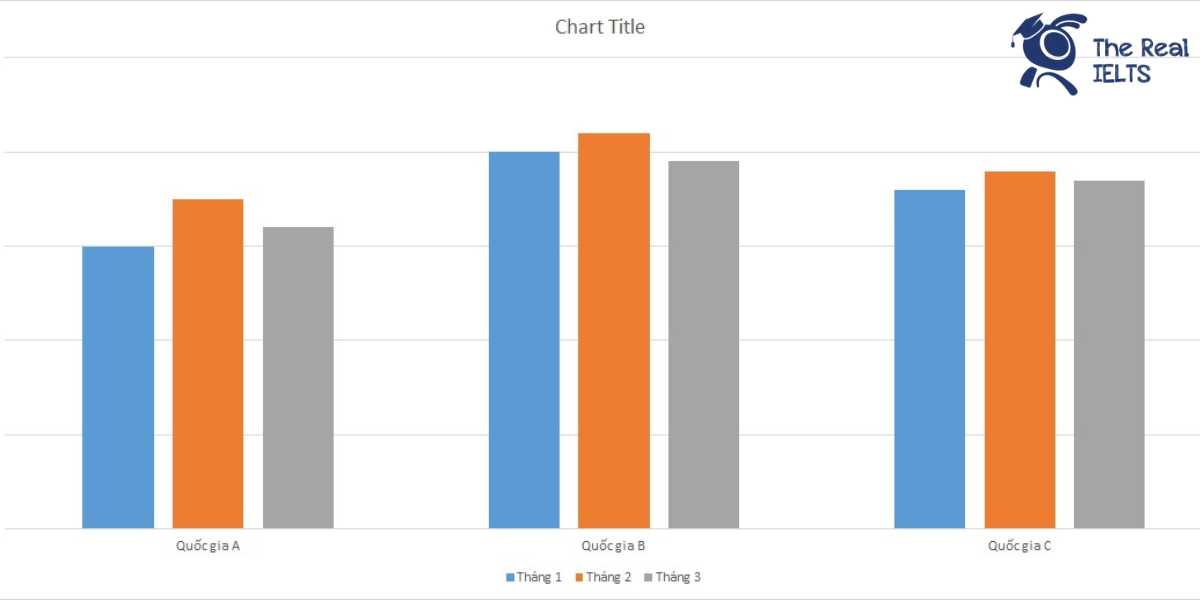
| Quốc gia | Tháng 1 | Tháng 2 | Tháng 3 |
| Quốc gia A | 150 | 175 | 160 |
| Quốc gia B | 200 | 210 | 195 |
| Quốc gia C | 180 | 190 | 185 |

Bài mẫu 1
Introduction:
The table provides a summary of the number of events held in three different countries (Country A, Country B, and Country C) over a span of three months (January, February, and March).
Overview:
Overall, Country B consistently hosted the highest number of events each month, while Country A had the lowest figures except in January. There were fluctuations in the number of events across all countries, with February generally seeing the highest numbers.
Body 1:
In January, Country B led with 200 events, followed by Country C with 180 events, and Country A with 150 events. This pattern changed in February, where the number of events increased for all three countries. Country B still had the highest number, with 210 events, and Country C saw a rise to 190 events. Country A experienced a notable increase to 175 events.
Body 2:
By March, the number of events in each country had slightly decreased compared to February. Country B remained the leader with 195 events, though this was a slight drop from the previous month. Country C hosted 185 events, showing a small decline. Country A also saw a decrease to 160 events, maintaining its position as the country with the fewest events for this month.
Conclusion:
In conclusion, Country B consistently hosted the most events over the three-month period, with February being the peak month for all three countries. Country A consistently had the lowest number of events each month except for January, where it had fewer events than Country C but more than Country B.
Bài mẫu 2
Introduction
The table presents data on the number of events organized in three countries (Country A, Country B, and Country C) over the first three months of the year.
Overview
Overall, Country B consistently had the highest number of events each month, while Country A generally had the lowest. Country C showed a slight increase in events from January to February but experienced a minor decrease in March.
Body 1
In January, Country B led with 200 events, followed by Country C with 180 events, and Country A with the least at 150 events. This trend continued into February, where Country B saw a small rise to 210 events. Country C also increased its events to 190, while Country A experienced the most significant rise to 175 events.
Body 2
By March, the number of events in Country B decreased slightly to 195, yet it remained the leader. Country C also saw a small drop to 185 events. In contrast, Country A experienced a decrease to 160 events. Despite these fluctuations, the overall ranking of the countries in terms of event numbers remained consistent across the three months.
In conclusion, the table highlights that Country B consistently hosted the most events, whereas Country A hosted the fewest, with slight month-to-month variations in each country.