Bài IELTS Writing Task 1 Bar Chart: Flu Infection sẽ có biểu đồ cột so sánh tỷ lệ mắc bệnh cúm trong 3 tháng ở 3 quốc gia châu Âu. Dữ liệu cho thấy sự khác biệt rõ rệt về tỷ lệ mắc bệnh giữa các quốc gia trong từng tháng, với một số quốc gia ghi nhận tỷ lệ cao hơn trong các tháng mùa đông, cho thấy ảnh hưởng của thời tiết và yếu tố môi trường.
Đọc bài này Cách làm bài IELTS Writing Task 1 Bar Chart trước khi làm bài.
Bạn cũng có thể đọc lại bài nói về Task 1 tại đây: IELTS Writing Task 1 cần lưu ý những gì?
Đọc thêm về xây dựng lộ trình học IELTS của The Real IELTS.
IELTS Writing Task 1 Bar Chart: Flu Infection
You should spent about 20 mintutes on this task
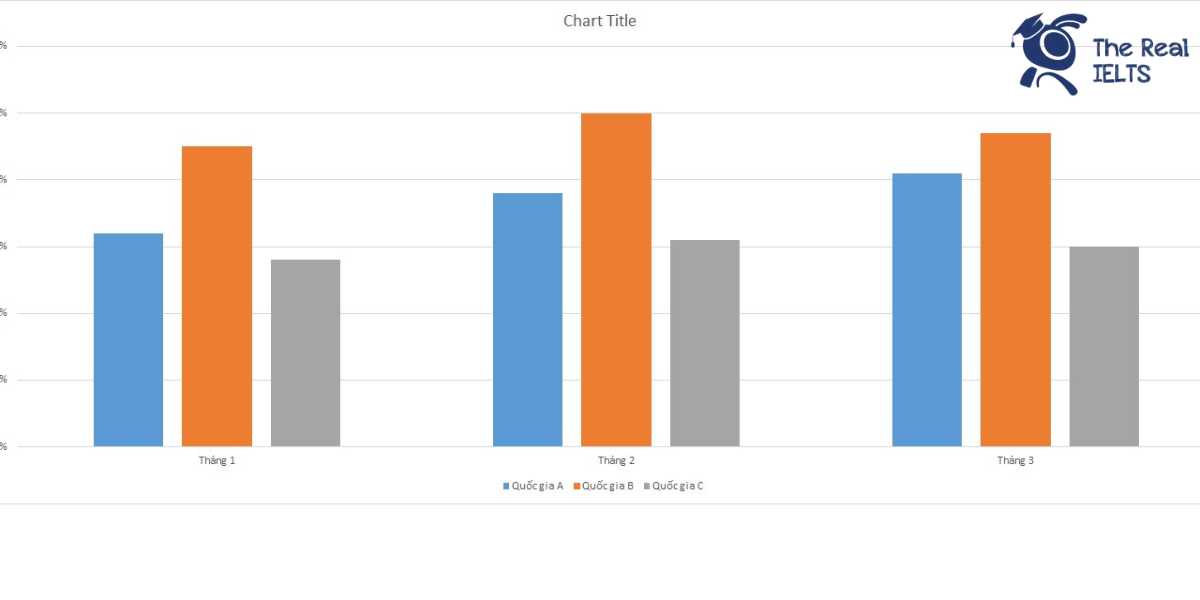
The bar chart compares the flu infection rates over three months in three European countries. The data reveals significant differences in infection rates between countries each month, with some countries recording higher rates during the winter months, indicating the impact of weather and environmental factors.
You should write at least 150 words.
| Tháng/Nước | Quốc gia A | Quốc gia B | Quốc gia C |
| Tháng 1 | 3.2% | 4.5% | 2.8% |
| Tháng 2 | 3.8% | 5.0% | 3.1% |
| Tháng 3 | 4.1% | 4.7% | 3.0% |

IELTS Writing 1
Overview
The table illustrates the influenza infection rates over a span of three months in three European countries: Country A, Country B, and Country C. The data captures the percentage of the population affected by influenza in January, February, and March. This information is crucial for understanding the seasonal trends and the relative impact of influenza across different regions.
Body 1
In January, the infection rates were relatively low across all three countries. Country A reported an infection rate of 3.2%, Country B had the highest rate at 4.5%, and Country C had the lowest rate at 2.8%. This indicates that during the start of the year, influenza was most prevalent in Country B, whereas Country C experienced the least impact.
Body 2
As the months progressed, the infection rates showed a noticeable increase. In February, Country A saw a rise to 3.8%, Country B’s rate climbed to 5.0%, and Country C increased slightly to 3.1%. By March, Country A’s infection rate reached 4.1%, Country B’s rate slightly decreased to 4.7%, and Country C’s rate decreased to 3.0%. This trend highlights a peak in February for Country B, while Country A continued to see an increasing trend, and Country C’s rates remained relatively stable with minor fluctuations.
In summary, the influenza infection rates varied across the three countries, with Country B generally experiencing higher rates compared to the other two. The data reflects the dynamic nature of influenza spread and emphasizes the importance of monitoring and preparedness in managing public health.
IELTS Writing 2
Overview
The statistics provided represent the influenza infection rates over three months in three European countries: Country A, Country B, and Country C. This data illustrates the fluctuation in infection rates from January to March, offering insights into the seasonal impact and the differences between the nations in terms of influenza prevalence.
Body 1
In January, the infection rates were 3.2% for Country A, 4.5% for Country B, and 2.8% for Country C. Country B had the highest rate of influenza infections, while Country C had the lowest. This could be attributed to various factors such as differences in healthcare infrastructure, population density, or public health policies.
Body 2
February saw a general increase in infection rates across all three countries. Country A’s rate rose to 3.8%, Country B’s to 5.0%, and Country C’s to 3.1%. This increase might indicate the peak of the flu season, suggesting that more aggressive measures might be needed during this time to control the spread of the virus.
Body 3
In March, Country A reported an infection rate of 4.1%, Country B’s rate slightly decreased to 4.7%, and Country C had a minor decrease to 3.0%. The data suggests that while the infection rates in Countries B and C began to stabilize, Country A continued to experience a rise. This trend could be analyzed to understand the efficacy of interventions and the natural progression of the flu season in different regions.