IELTS Writing Task 1 yêu cầu bạn phân tích và mô tả dữ liệu từ biểu đồ. Ví dụ, biểu đồ cột cho thấy tỷ lệ bệnh nhân mắc bệnh theo mùa trong 3 tháng từ 3 thành phố khác nhau. Nhiệt độ ảnh hưởng đáng kể đến tỷ lệ này. Nội dung viết bao gồm mô tả chi tiết và so sánh các số liệu để đưa ra nhận định và phân tích hợp lý.
Đọc bài này Cách làm bài IELTS Writing Task 1 Bar Chart trước khi làm bài.
Bạn cũng có thể đọc lại bài nói về Task 1 tại đây: IELTS Writing Task 1 cần lưu ý những gì?
IELTS Writing Task 1 Bar Chart: Illness Rates
You should spent about 20 mintutes on this task
IELTS Writing Task 1 requires you to analyze and describe data from charts. For example, a bar chart depicts the seasonal illness rates over three months in three different cities. Temperature significantly influences these rates. Your writing should include detailed descriptions and comparisons of the data to provide reasoned analysis and insights.
You should write at least 150 words.

Bài mẫu 1
Introduction
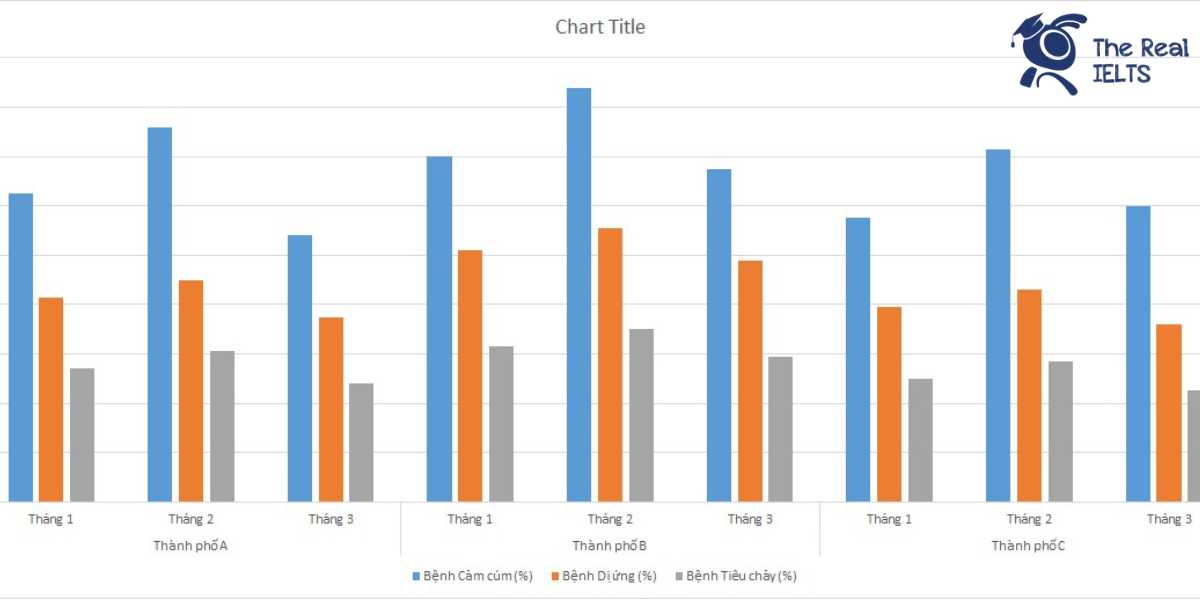
The table provides information about the percentage of patients suffering from three types of illnesses—flu, allergies, and diarrhea—across three cities (City A, City B, and City C) over a three-month period.
Overview
Overall, City B has the highest percentages of patients with all three illnesses across the months, while City C consistently has the lowest percentages. Additionally, flu rates are generally higher than those for allergies and diarrhea in all cities.
Body 1
In City A, flu rates start at 12.5% in January, rise to 15.2% in February, and then drop to 10.8% in March. Allergy rates slightly increase from 8.3% in January to 9.0% in February before falling to 7.5% in March. Diarrhea rates show a similar trend, beginning at 5.4% in January, peaking at 6.1% in February, and decreasing to 4.8% in March.
City B records the highest rates across all months for all illnesses. Flu rates are 14.0% in January, 16.8% in February, and 13.5% in March. Allergy rates follow the same pattern, with 10.2% in January, 11.1% in February, and 9.8% in March. Diarrhea rates are also the highest in City B, starting at 6.3% in January, increasing to 7.0% in February, and then dropping to 5.9% in March.
Body 2
City C exhibits the lowest percentages of patients suffering from these illnesses. Flu rates are 11.5% in January, rise to 14.3% in February, and decrease to 12.0% in March. Allergy rates are 7.9% in January, slightly increase to 8.6% in February, and then decrease to 7.2% in March. Diarrhea rates are consistently low, starting at 5.0% in January, peaking at 5.7% in February, and falling to 4.5% in March.
In summary, City B has the highest incidence of flu, allergies, and diarrhea, while City C has the lowest, with City A’s rates fluctuating between the two.
Bài mẫu 2
The table provides data on the percentage of patients suffering from influenza, allergies, and diarrhea over three months in three cities.
Overview: Overall, the data indicates that the incidence rates of these diseases vary across the three cities and months. Generally, influenza and allergies exhibit higher percentages than diarrhea, with February showing the highest rates for all diseases in most cases.
Body 1: In City A, the percentage of patients with influenza peaks in February at 15.2%, followed by a decrease to 10.8% in March. Allergy rates show a similar pattern, rising from 8.3% in January to 9.0% in February, then dropping to 7.5% in March. Diarrhea rates are the lowest among the three diseases, peaking at 6.1% in February and falling to 4.8% in March.
Body 2: City B displays the highest rates among the three cities, with influenza peaking at 16.8% in February. Allergy rates reach 11.1% in February before declining to 9.8% in March. Diarrhea rates, while still lower than the other diseases, peak at 7.0% in February. City C shows a similar trend with influenza reaching its highest at 14.3% in February, and allergies peaking at 8.6% the same month. Diarrhea rates remain the lowest, peaking at 5.7% in February and decreasing to 4.5% in March.
In summary, influenza and allergy rates tend to peak in February across all three cities, while diarrhea consistently shows the lowest incidence rates throughout the observed period.
Bài mẫu 3
Introduction:
The table provides a statistical representation of the percentage of patients suffering from three different illnesses—flu, allergies, and diarrhea—over three months (January, February, and March) across three cities: City A, City B, and City C.
Overview:
Overall, the data shows that the highest rates of flu and allergies are observed in February for all cities, while the percentages for diarrhea remain relatively stable but lower compared to the other two illnesses. City B generally exhibits the highest percentages across all three illnesses, whereas City C consistently shows the lowest.
Body 1:
In January, City A had 12.5% of flu patients, which increased to 15.2% in February and then dropped to 10.8% in March. Allergy cases followed a similar trend, starting at 8.3% in January, peaking at 9.0% in February, and decreasing to 7.5% in March. Diarrhea cases in City A showed a slight increase from 5.4% in January to 6.1% in February before falling to 4.8% in March.
City B exhibited a similar pattern. Flu cases rose from 14.0% in January to 16.8% in February and then declined to 13.5% in March. Allergy cases went from 10.2% in January to 11.1% in February, dropping to 9.8% in March. Diarrhea cases increased from 6.3% in January to 7.0% in February and then decreased to 5.9% in March.
Body 2:
City C, while following the same general trends, had lower percentages overall. Flu cases rose from 11.5% in January to 14.3% in February, then fell to 12.0% in March. Allergy cases increased from 7.9% in January to 8.6% in February, then decreased to 7.2% in March. Diarrhea cases were 5.0% in January, increased to 5.7% in February, and dropped to 4.5% in March.
In summary, February appears to be the peak month for flu and allergy cases in all three cities, with City B having the highest percentages and City C the lowest across the board. Diarrhea cases are relatively lower and more stable in comparison.