IELTS Writing Task 1 yêu cầu mô tả biểu đồ cột về số lượng hồ sơ vay vốn trong 3 ngày của 3 ngân hàng khác nhau. Biểu đồ thể hiện rõ ràng sự biến động về số lượng hồ sơ vay vốn giữa các ngân hàng qua các ngày. Người viết cần phân tích và so sánh dữ liệu, đưa ra nhận xét về xu hướng và sự khác biệt.
Đọc bài này Cách làm bài IELTS Writing Task 1 Bar Chart trước khi làm bài.
Bạn cũng có thể đọc lại bài nói về Task 1 tại đây: IELTS Writing Task 1 cần lưu ý những gì?
Đọc thêm về xây dựng lộ trình học IELTS của The Real IELTS.
IELTS Writing Task 1 Bar Chart: Loan Applications
You should spent about 20 mintutes on this task
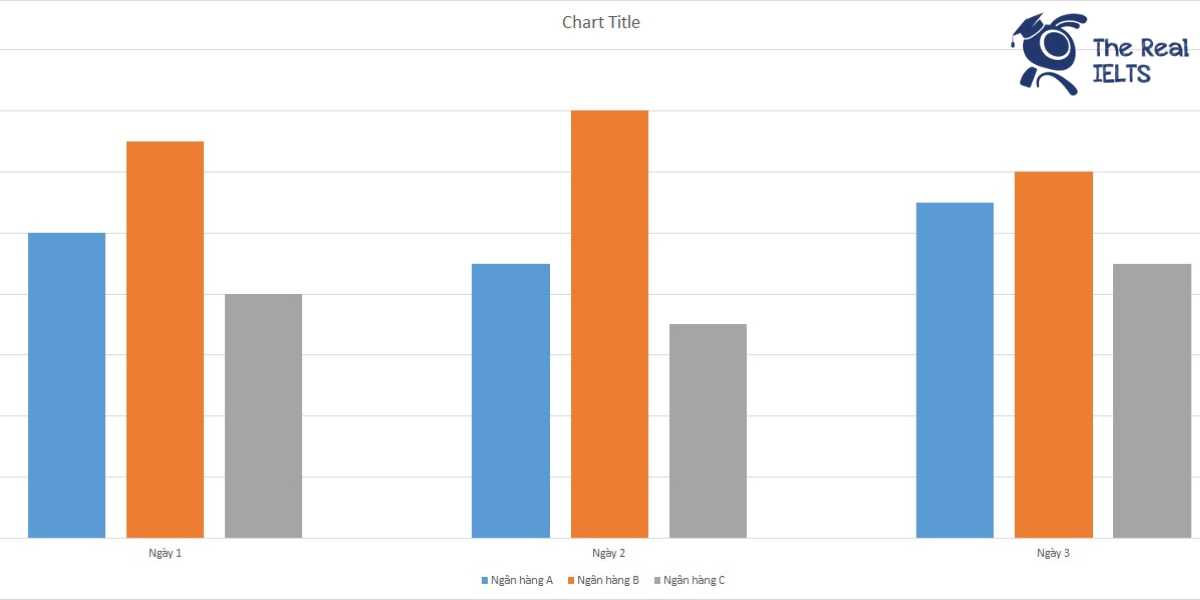
IELTS Writing Task 1 requires describing a bar chart showing the number of loan applications over 3 days at 3 different banks. The chart clearly illustrates the fluctuations in the number of loan applications among the banks over the days. The writer needs to analyze and compare the data, providing comments on the trends and differences.
You should write at least 150 words.
| Ngày | Ngân hàng A | Ngân hàng B | Ngân hàng C |
| Ngày 1 | 50 | 65 | 40 |
| Ngày 2 | 45 | 70 | 35 |
| Ngày 3 | 55 | 60 | 45 |

Bài mẫu 1
Overview
This report analyzes the number of loan applications received by three different banks (Bank A, Bank B, and Bank C) over a period of three days. The data provides insights into the daily loan application trends for each bank, allowing for a comparative analysis of their performance.
Body 1: Daily Loan Applications
On Day 1, Bank A received 50 loan applications, Bank B received 65, and Bank C received 40. This indicates that Bank B was the most popular choice for loan applicants on the first day, with Bank A and Bank C trailing behind.
On Day 2, the trend shifted slightly. Bank A saw a decrease in applications, receiving 45, while Bank B experienced an increase, receiving 70 applications. Bank C, on the other hand, saw a decrease, receiving only 35 applications. This suggests that while Bank B’s popularity continued to grow, Bank A and Bank C faced a decline in their loan applications.
Body 2: Comparative Analysis
On Day 3, Bank A rebounded slightly with 55 loan applications, whereas Bank B experienced a decrease to 60 applications. Bank C saw an increase, receiving 45 applications. Over the three days, Bank B consistently received the highest number of applications, indicating a strong preference or better marketing strategies compared to Banks A and C.
Comparatively, Bank A had a moderate performance with fluctuations, while Bank C showed the least number of applications but managed a slight increase by Day 3. The overall data suggests that Bank B is the most favored among the three, followed by Bank A and then Bank C.
This analysis highlights the competitive nature of loan applications among banks and can be used to strategize for better customer engagement and service improvements.
Bài mẫu 2
Overview
The data presented shows the number of loan applications received over three days by three different banks: Bank A, Bank B, and Bank C. The figures provide insights into the daily performance of each bank in terms of loan application processing, highlighting trends and variations in customer engagement across the given period.
Body 1
On Day 1, Bank A received 50 loan applications, Bank B received 65, and Bank C received 40. This indicates that Bank B had the highest number of loan applications, followed by Bank A, with Bank C trailing behind. The figures suggest that Bank B may have had a more aggressive marketing strategy or better customer outreach on that particular day.
On Day 2, there was a slight decrease in the number of applications for Bank A, dropping to 45. In contrast, Bank B experienced an increase, receiving 70 applications. Bank C saw a decrease, with only 35 applications submitted. The drop in applications for Bank A and Bank C could be due to various factors, such as customer satisfaction, service quality, or market conditions.
Body 2
Day 3 showed a rebound for Bank A, with the number of applications rising to 55. Bank B, however, experienced a decrease, receiving only 60 applications. Bank C saw an increase, with 45 applications. The increase for Bank A and Bank C could be attributed to improved customer service, promotional activities, or seasonal factors that influenced customer decisions.
Overall, Bank B consistently received the highest number of applications over the three days, suggesting a strong presence in the market. Bank A showed fluctuations but managed to recover by Day 3, while Bank C experienced the lowest but steady performance with a slight improvement on the final day. This data can help the banks analyze their performance, identify areas for improvement, and strategize for better customer engagement and service delivery.