IELTS Writing Task 1 yêu cầu bạn mô tả một biểu đồ cột (Bar Chart) về số lượng sản phẩm bán ra hàng tháng trong năm 2021 của bốn cửa hàng. Bạn cần phân tích các số liệu, so sánh sự khác biệt giữa các cửa hàng, và xu hướng thay đổi trong năm.
Đọc bài này Cách làm bài IELTS Writing Task 1 Bar Chart trước khi làm bài.
Bạn cũng có thể đọc lại bài nói về Task 1 tại đây: IELTS Writing Task 1 cần lưu ý những gì?
IELTS Writing Task 1 Bar Chart: Products
You should spent about 20 mintutes on this task
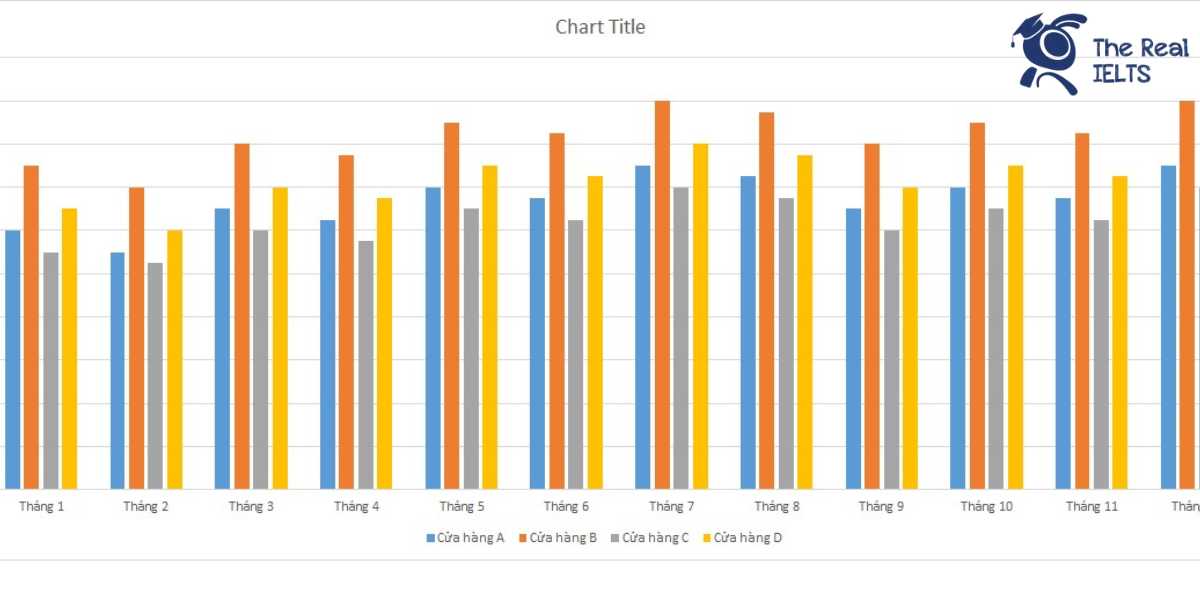
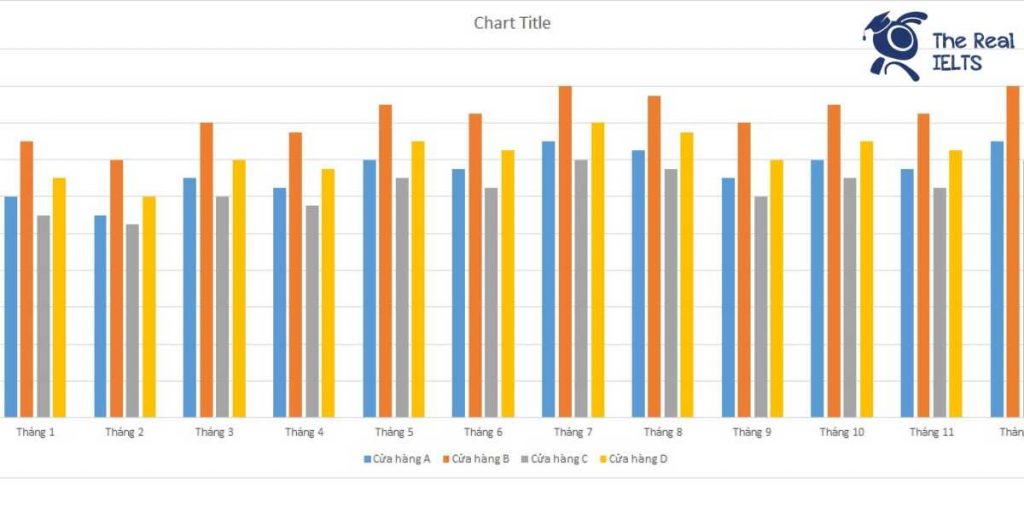
IELTS Writing Task 1 requires you to describe a bar chart showing the number of products sold monthly in 2021 by four stores. You need to analyze the data, compare the differences between the stores, and identify the trends throughout the year.
You should write at least 150 words.
| Tháng | Cửa hàng A | Cửa hàng B | Cửa hàng C | Cửa hàng D |
| Tháng 1 | 500,000 | 620,000 | 580,000 | 490,000 |
| Tháng 2 | 450,000 | 590,000 | 560,000 | 470,000 |
| Tháng 3 | 520,000 | 650,000 | 600,000 | 500,000 |
| Tháng 4 | 480,000 | 610,000 | 570,000 | 450,000 |
| Tháng 5 | 530,000 | 670,000 | 610,000 | 510,000 |
| Tháng 6 | 490,000 | 620,000 | 580,000 | 470,000 |
| Tháng 7 | 550,000 | 680,000 | 640,000 | 530,000 |
| Tháng 8 | 510,000 | 640,000 | 600,000 | 490,000 |
| Tháng 9 | 570,000 | 700,000 | 660,000 | 550,000 |
| Tháng 10 | 530,000 | 660,000 | 620,000 | 510,000 |
| Tháng 11 | 590,000 | 720,000 | 680,000 | 570,000 |
| Tháng 12 | 550,000 | 680,000 | 640,000 | 530,000 |
Bài mẫu
The table shows the number of products sold monthly in 2021 by four stores (Store A, Store B, Store C, and Store D).
Overall, Store B consistently sold the highest number of products each month, while Store D had the lowest sales. All stores experienced fluctuations throughout the year, with peaks and troughs observed at different points.
In the first half of the year, Store B had the highest sales, starting at 620 units in January and peaking at 670 units in May. Store A’s sales were relatively steady, beginning at 500 units in January and slightly increasing to 530 units by May. Store C also showed a steady increase from 580 units in January to 610 units in May. Store D, however, had lower sales, starting at 490 units in January and dipping to 450 units in April before rising back to 510 units in May.
In the second half of the year, sales for all stores generally increased, with Store B continuing to lead, reaching a peak of 720 units in November. Store A saw its highest sales in September at 570 units, while Store C’s sales also peaked in September at 660 units. Store D had its highest sales in November at 570 units. Despite some fluctuations, Store B consistently outperformed the other stores, while Store D had the lowest sales throughout the year.
Overall, the table indicates that Store B was the most successful in terms of monthly product sales in 2021, whereas Store D struggled the most.