IELTS Writing Task 1 yêu cầu bạn phân tích và mô tả các biểu đồ. Trong bài thực hành này, biểu đồ Bar Chart thể hiện số lượng ca phẫu thuật trong 3 ngày của 3 bệnh viện lớn. Biểu đồ cho thấy sự khác biệt rõ rệt về số liệu giữa các bệnh viện trong từng ngày. Việc phân tích biểu đồ này sẽ yêu cầu bạn mô tả các xu hướng, sự khác biệt và nhận định về những thay đổi có thể xảy ra theo thời gian.
Đọc bài này Cách làm bài IELTS Writing Task 1 Bar Chart trước khi làm bài.
Bạn cũng có thể đọc lại bài nói về Task 1 tại đây: IELTS Writing Task 1 cần lưu ý những gì?
Đọc thêm về xây dựng lộ trình học IELTS của The Real IELTS.
IELTS Writing Task 1 Bar Chart: Surgeries
You should spent about 20 mintutes on this task
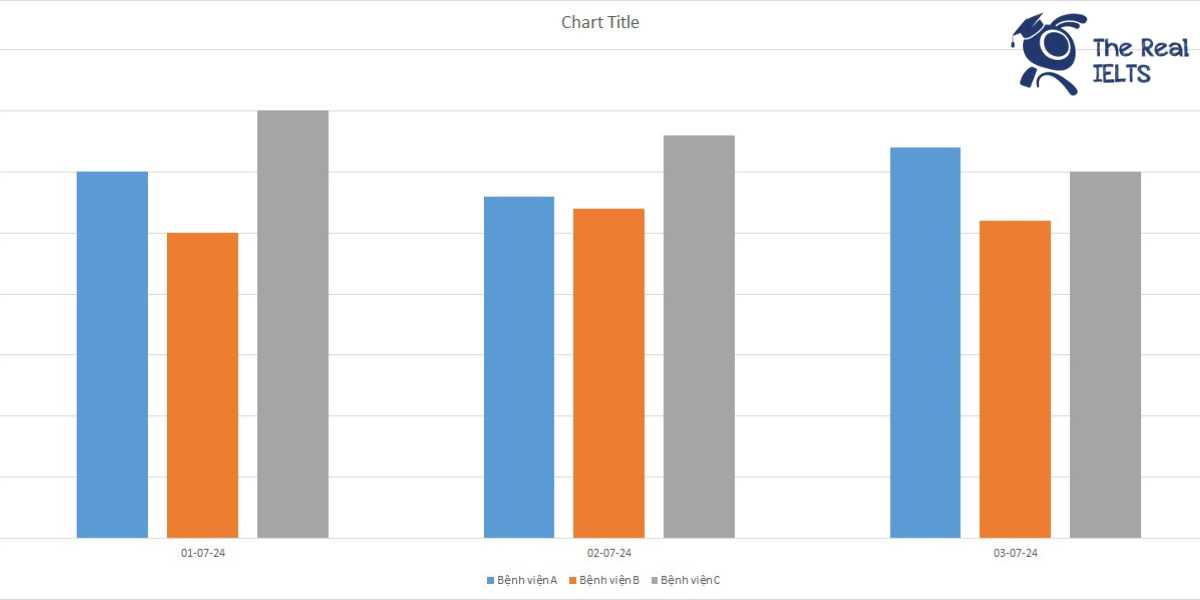
IELTS Writing Task 1 requires you to analyze and describe charts. In this practice task, a Bar Chart illustrates the number of surgeries over three days across three major hospitals. The chart highlights significant differences in data among the hospitals on each day. Analyzing this chart involves describing trends, disparities, and making observations about potential changes over time.
You should write at least 150 words.
| Ngày | Bệnh viện A | Bệnh viện B | Bệnh viện C |
| 01-07-24 | 30 | 25 | 35 |
| 02-07-24 | 28 | 27 | 33 |
| 03-07-24 | 32 | 26 | 30 |

Bài mẫu 1
Overview
The table presents the number of surgeries conducted over three days (from July 1st to July 3rd, 2024) at three major hospitals: Hospital A, Hospital B, and Hospital C. The data provides a comparative look at the surgical activities within these institutions, revealing trends and fluctuations over the given period.
Body 1
On July 1st, 2024, Hospital A reported 30 surgeries, leading the day with a significant number of operations. Hospital B followed with 25 surgeries, while Hospital C had the highest number among the three, with 35 surgeries. This indicates a high level of surgical activity at Hospital C on the first day, surpassing the other two hospitals.
Body 2
The subsequent days saw slight variations in the number of surgeries performed. On July 2nd, 2024, Hospital A experienced a slight decrease to 28 surgeries, Hospital B saw a minor increase to 27 surgeries, and Hospital C’s operations slightly decreased to 33. On the final day, July 3rd, 2024, Hospital A peaked at 32 surgeries, Hospital B returned to 26 surgeries, and Hospital C saw a decrease to 30 surgeries. This data shows that while the number of surgeries fluctuated, Hospital A and C remained the most active in terms of surgical procedures over the three-day period.
Bài mẫu 2
Overview
This report presents a statistical analysis of the number of surgeries performed in three major hospitals—Hospital A, Hospital B, and Hospital C—over a three-day period. The data covers the dates from July 1, 2024, to July 3, 2024. By examining this data, we can gain insights into the surgical workload and efficiency of each hospital during this time frame.
Body 1: Hospital A Performance
Hospital A demonstrated a relatively consistent performance over the three days. On July 1, 2024, it conducted 30 surgeries, the highest number among the three hospitals on that day. The following day, the number slightly decreased to 28, but it rose again to 32 on July 3, 2024. This fluctuation indicates a stable yet flexible capacity to handle surgical procedures. The ability to increase the number of surgeries by four from July 2 to July 3 suggests an efficient allocation of resources and staffing.
Body 2: Hospital B and C Performance
Hospital B showed minimal variation in the number of surgeries performed, with figures ranging from 25 to 27 over the three days. On July 1, 2024, it performed 25 surgeries, increased to 27 on July 2, and then slightly decreased to 26 on July 3. This consistency highlights a steady workflow but also suggests potential limits in expanding surgical capacity.
Hospital C, on the other hand, started with the highest number of surgeries at 35 on July 1, 2024. The number then decreased to 33 on July 2, and further to 30 on July 3. Although Hospital C started strong, the gradual decline might indicate either a strategic reduction in surgical load or issues such as resource constraints or patient intake variability.
Conclusion
In summary, Hospital A exhibited the most dynamic response in its surgical numbers, suggesting flexibility and efficient management. Hospital B maintained a consistent surgical volume, reflecting a stable but possibly limited capacity. Hospital C, while starting with the highest number of surgeries, showed a declining trend, which could warrant further investigation to understand the underlying causes. Analyzing such data helps in assessing hospital performance and planning for future healthcare needs.