IELTS Writing Task 1 yêu cầu mô tả biểu đồ số lượt tải ứng dụng hàng tháng của bốn công ty khác nhau trong năm 2010. Thí sinh cần phân tích và so sánh số liệu, xác định xu hướng, điểm nổi bật và biến động trong suốt năm. Bài viết cần logic, rõ ràng, và chính xác về số liệu.
Bạn có thể đọc lại bài nói về Task 1 tại đây: IELTS Writing Task 1 cần lưu ý những gì?
Bạn cũng có thể đọc thêm bài viết này vì đề bài này là IELTS Writing Task 1 biểu đồ Line Graph.
IELTS Writing Task 1 Line Graph: application downloads
You should spent about 20 mintutes on this task
IELTS Writing Task 1 requires describing the chart of monthly application downloads of four different companies in 2010. Candidates need to analyze and compare the data, identify trends, highlights, and fluctuations throughout the year. The writing should be logical, clear, and accurate in terms of data.
You should write at least 150 words.
| Tháng | Công ty A | Công ty B | Công ty C | Công ty D |
| Tháng 1 | 120,000 | 95,000 | 80,000 | 110,000 |
| Tháng 2 | 125,000 | 100,000 | 85,000 | 115,000 |
| Tháng 3 | 130,000 | 105,000 | 90,000 | 120,000 |
| Tháng 4 | 135,000 | 110,000 | 95,000 | 125,000 |
| Tháng 5 | 140,000 | 115,000 | 100,000 | 130,000 |
| Tháng 6 | 145,000 | 120,000 | 105,000 | 135,000 |
| Tháng 7 | 150,000 | 125,000 | 110,000 | 140,000 |
| Tháng 8 | 155,000 | 130,000 | 115,000 | 145,000 |
| Tháng 9 | 160,000 | 135,000 | 120,000 | 150,000 |
| Tháng 10 | 165,000 | 140,000 | 125,000 | 155,000 |
| Tháng 11 | 170,000 | 145,000 | 130,000 | 160,000 |
| Tháng 12 | 175,000 | 150,000 | 135,000 | 165,000 |

Bài tham khảo 1
Introduction
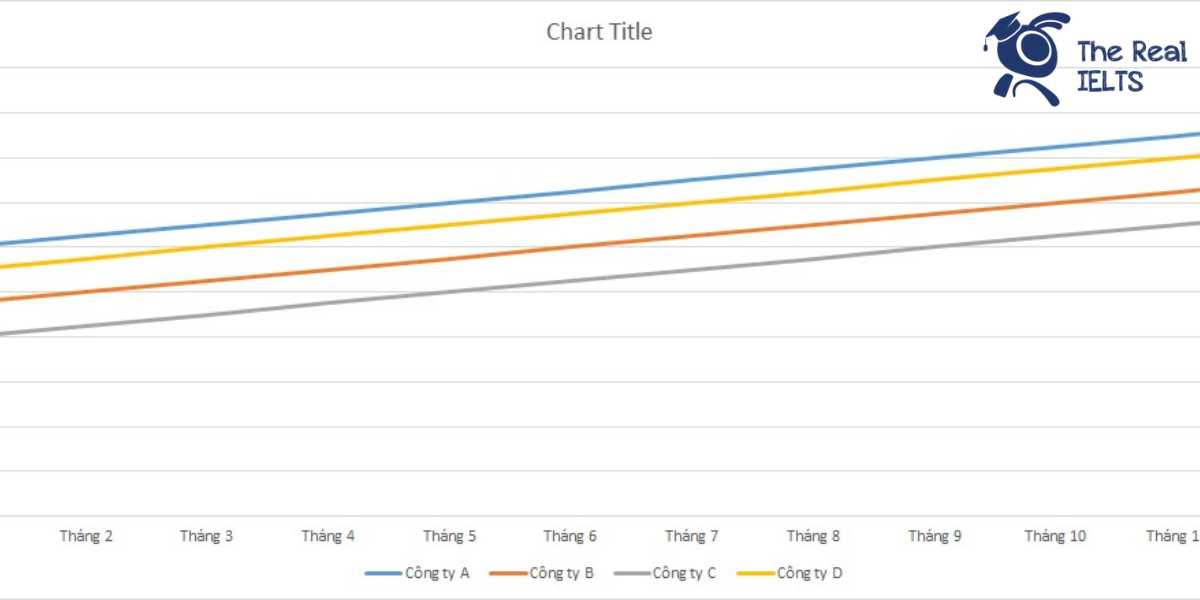
The line graph illustrates the number of monthly application downloads from four different companies (A, B, C, and D) throughout the year 2010.
Overview
Overall, all four companies experienced a steady increase in the number of downloads over the 12-month period. Company A consistently had the highest number of downloads each month, while Company C had the lowest. Despite these differences, the upward trends were noticeable across all companies.
Body 1
In January, Company A started with 120,000 downloads, followed by Company D with 110,000, Company B with 95,000, and Company C with 80,000. By mid-year (June), the downloads had increased to 145,000 for Company A, 135,000 for Company D, 120,000 for Company B, and 105,000 for Company C. This shows a steady rise of 25,000 to 40,000 downloads for each company over six months.
Body 2
From July to December, the upward trend continued. Company A’s downloads reached 175,000 by December, maintaining its lead. Company D followed with 165,000 downloads, Company B with 150,000, and Company C with 135,000. The data indicates that while Company A consistently had the highest downloads, all companies demonstrated significant growth, with each seeing an increase of 55,000 downloads from the start to the end of the year.
Bài tham khảo 2
The line graph illustrates the number of monthly app downloads by four companies (A, B, C, and D) in the year 2010. The data presented is hypothetical for the purpose of this example.
Overall, the number of app downloads increased consistently for all four companies throughout the year. Company A had the highest number of downloads each month, while Company C had the lowest. The differences between the companies’ download numbers widened as the year progressed.
In January, Company A had the highest number of downloads at 120,000, followed by Company D with 110,000, Company B with 95,000, and Company C with 80,000. By June, the downloads for each company had increased by 25,000, maintaining the same order of ranking. Company A led with 145,000 downloads, while Company C remained the lowest with 105,000.
In the second half of the year, the trend continued with all companies experiencing steady growth. By December, Company A’s downloads had reached 175,000, marking an increase of 55,000 from January. Company D saw the second highest growth, ending the year with 165,000 downloads. Company B and Company C followed with 150,000 and 135,000 downloads respectively.
In conclusion, all four companies showed significant and consistent growth in app downloads throughout 2010, with Company A consistently leading in the number of downloads each month.
Bài tham khảo 3
Introduction:
The line graph illustrates the monthly download figures for applications from four different companies (A, B, C, and D) throughout the year 2010.
Overview:
Overall, the number of downloads for all four companies showed a steady increase over the year. Company A consistently had the highest number of downloads each month, while Company C had the lowest figures initially but experienced growth over the period.
Body 1:
In January, Company A led with 120,000 downloads, followed by Company D with 110,000 downloads. Company B and Company C had 95,000 and 80,000 downloads, respectively. Over the first half of the year, all companies saw a gradual increase in downloads. By June, Company A had reached 145,000 downloads, maintaining its lead, while Company D followed closely with 135,000 downloads. Companies B and C also grew, with 120,000 and 105,000 downloads, respectively.
Body 2:
The trend continued in the latter half of the year, with each company experiencing a steady rise in download numbers. By December, Company A had peaked at 175,000 downloads, still the highest among the four. Company B’s downloads increased to 150,000, surpassing Company D, which had 165,000 downloads. Company C, which started with the lowest figures, ended the year with 135,000 downloads, indicating significant growth throughout 2010.
In conclusion, while all companies showed an upward trend in application downloads, Company A remained the leader throughout the year, and Company C showed the most notable improvement.