IELTS Writing Task 1 yêu cầu mô tả biểu đồ lượng sách bán ra hàng tháng trong năm 2011 tại bốn thành phố: New York, London, Paris và Tokyo. Thí sinh phải phân tích và so sánh dữ liệu, làm nổi bật các xu hướng chính, điểm cao nhất và thấp nhất, cũng như bất kỳ biến động đáng chú ý nào trong suốt năm.
Bạn có thể đọc lại bài nói về Task 1 tại đây: IELTS Writing Task 1 cần lưu ý những gì?
Bạn cũng có thể đọc thêm bài viết này vì đề bài này là IELTS Writing Task 1 biểu đồ Line Graph.
Bạn cũng có thể Xây Dựng Lộ Trình Cá Nhân Hóa của mình tại link.
IELTS Writing Task 1 Line Graph: Book Sales
You should spent about 20 mintutes on this task
IELTS Writing Task 1 requires describing a chart showing the monthly book sales in 2011 in four cities: New York, London, Paris, and Tokyo. Candidates must analyze and compare the data, highlighting key trends, the highest and lowest points, as well as any notable fluctuations throughout the year.
You should write at least 150 words.
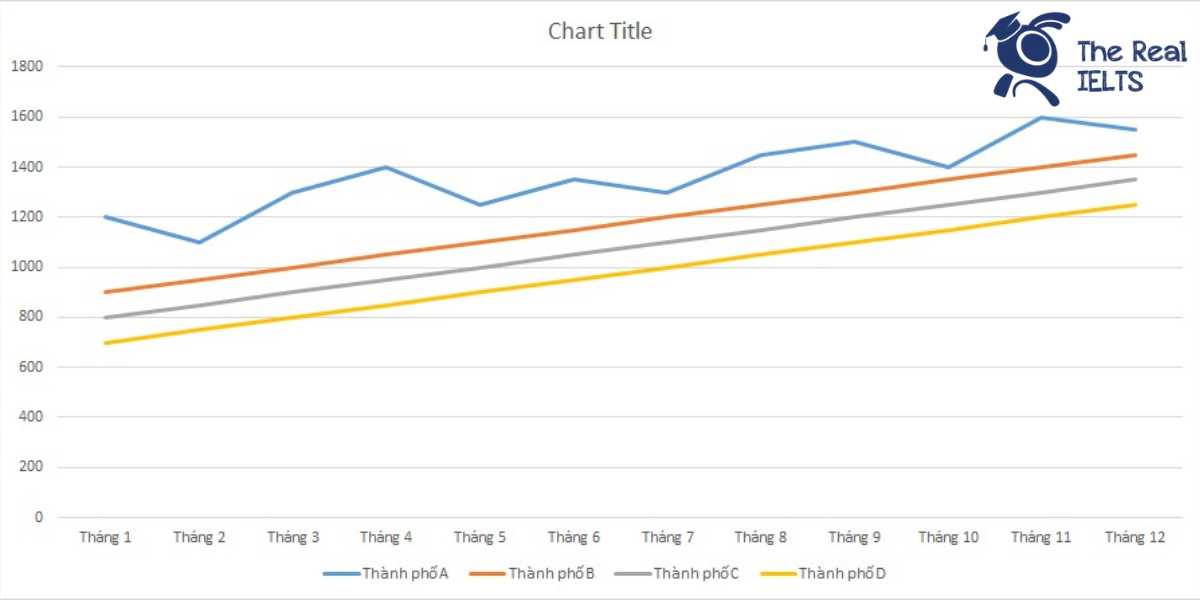
| Tháng | Thành phố A | Thành phố B | Thành phố C | Thành phố D |
| Tháng 1 | 1200 | 900 | 800 | 700 |
| Tháng 2 | 1100 | 950 | 850 | 750 |
| Tháng 3 | 1300 | 1000 | 900 | 800 |
| Tháng 4 | 1400 | 1050 | 950 | 850 |
| Tháng 5 | 1250 | 1100 | 1000 | 900 |
| Tháng 6 | 1350 | 1150 | 1050 | 950 |
| Tháng 7 | 1300 | 1200 | 1100 | 1000 |
| Tháng 8 | 1450 | 1250 | 1150 | 1050 |
| Tháng 9 | 1500 | 1300 | 1200 | 1100 |
| Tháng 10 | 1400 | 1350 | 1250 | 1150 |
| Tháng 11 | 1600 | 1400 | 1300 | 1200 |
| Tháng 12 | 1550 | 1450 | 1350 | 1250 |

Bài tham khảo 1
Introduction: The table provides detailed information on the monthly sales of books in four cities (A, B, C, and D) throughout the year 2011.
Overview: Overall, the data indicates an upward trend in book sales across all cities over the year. City A consistently had the highest sales figures each month, while City D had the lowest.
Body 1: City A started the year with 1200 books sold in January, and despite some fluctuations, the number generally increased, peaking at 1600 books in November. Similarly, City B began with 900 books sold in January and saw a steady rise to 1450 books in December, with a gradual increase each month.
Body 2: City C and City D exhibited similar patterns, though their sales figures were consistently lower than those of Cities A and B. City C’s sales grew from 800 books in January to 1350 books in December, while City D’s sales started at 700 books in January and increased to 1250 books in December. Despite the lower initial figures, both cities showed a positive trend in book sales over the year.
Bài tham khảo 2
The table below illustrates the monthly sales of books in four different cities throughout 2011.
Overview: Overall, the number of books sold in all four cities showed an increasing trend over the year. City A consistently had the highest sales, while City D had the lowest. The most significant rise in sales occurred in the final quarter of the year.
Body 1: In the first half of the year, City A started with 1,200 books sold in January and saw a fluctuating but generally upward trend, reaching 1,350 in June. Similarly, City B began at 900 and ended at 1,150 in June, with a steady increase each month. City C and City D also followed this pattern, starting at 800 and 700 respectively, and rising to 1,050 and 950 by mid-year.
Body 2: In the latter half of the year, the trend continued to rise more sharply. City A’s sales peaked at 1,600 in November before a slight drop to 1,550 in December. City B also saw a steady increase, reaching its highest point of 1,450 in December. City C and City D experienced similar growth, ending the year with 1,350 and 1,250 books sold respectively. Notably, the final quarter showed the most substantial increases, reflecting a strong year-end performance across all cities.
In summary, the data indicates a positive sales trend for books in all four cities throughout 2011, with the most significant growth observed in the last quarter.
Bài tham khảo 3
Introduction
The table provides data on the monthly book sales in four different cities (City A, City B, City C, and City D) for the year 2011.
Overview
Overall, City A consistently had the highest book sales throughout the year, while City D had the lowest. Sales in all cities showed an upward trend, with notable peaks towards the end of the year.
Body 1
In January, City A started with 1,200 books sold, followed by City B with 900, City C with 800, and City D with 700. By March, sales had increased across all cities, with City A reaching 1,300 books, City B at 1,000, City C at 900, and City D at 800. This upward trend continued into mid-year, with City A selling 1,350 books in June, City B with 1,150, City C with 1,050, and City D with 950.
Body 2
The second half of the year saw further increases, particularly in the last quarter. In September, City A sold 1,500 books, City B 1,300, City C 1,200, and City D 1,100. November marked the peak for City A with 1,600 books sold. Similarly, City B, City C, and City D also experienced their highest sales in December, with figures reaching 1,450, 1,350, and 1,250 respectively. The overall trend indicates a consistent rise in book sales across all four cities throughout 2011.
Bài tham khảo 4
Introduction
The table provides data on the monthly book sales in 2011 across four cities: A, B, C, and D.
Overview
Overall, book sales increased steadily over the year in all four cities. City A consistently sold the highest number of books each month, while City D sold the least.
Body 1
In the first half of the year, City A saw a rise from 1200 books in January to 1350 books in June, with a slight dip in February. City B’s sales increased more steadily from 900 in January to 1150 in June. City C followed a similar trend, growing from 800 in January to 1050 in June. City D, although starting at the lowest point with 700 books sold in January, also showed a steady increase, reaching 950 by June.
Body 2
In the second half of the year, all cities experienced more significant increases. City A peaked at 1600 books in November before slightly dropping to 1550 in December. City B continued to rise steadily, reaching 1450 books by December. City C’s sales peaked at 1350 in December, while City D, despite being the lowest, saw the highest percentage increase, peaking at 1250 in December. The trend indicates a general growth in book sales towards the end of the year across all cities.