IELTS Writing Task 1 yêu cầu bạn mô tả số lượng xe bán ra hàng tháng của bốn công ty trong năm 2022. Bạn cần phân tích và so sánh dữ liệu, tập trung vào các xu hướng, điểm cao nhất, thấp nhất và sự biến động theo thời gian. Bài viết nên rõ ràng, mạch lạc và có cấu trúc hợp lý.
Bạn có thể đọc lại bài nói về Task 1 tại đây: IELTS Writing Task 1 cần lưu ý những gì?
Bạn cũng có thể đọc thêm bài viết này vì đề bài này là IELTS Writing Task 1 biểu đồ Line Graph.
IELTS Writing Task 1 Line Graph: Car Sales
You should spent about 20 mintutes on this task
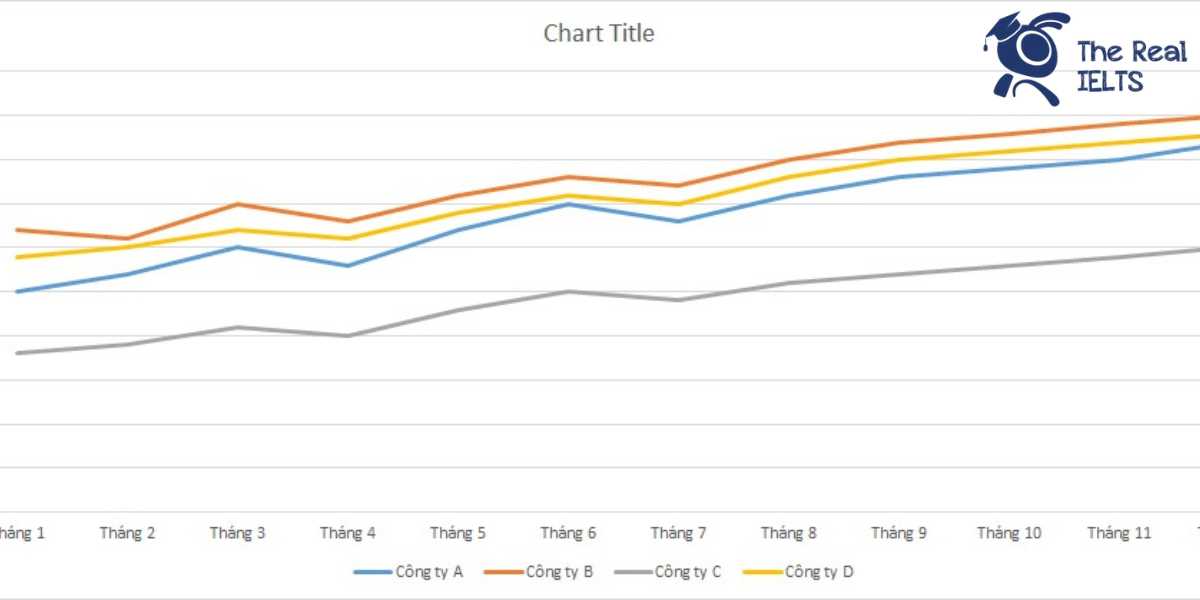
IELTS Writing Task 1 requires you to describe the monthly car sales of four companies in 2022. You need to analyze and compare the data, focusing on trends, highest and lowest points, and fluctuations over time. The essay should be clear, coherent, and well-structured.
You should write at least 150 words.
| Tháng | Công ty A | Công ty B | Công ty C | Công ty D |
| Tháng 1 | 2,5 | 3,2 | 1,8 | 2,9 |
| Tháng 2 | 2,7 | 3,1 | 1,9 | 3 |
| Tháng 3 | 3 | 3,5 | 2,1 | 3,2 |
| Tháng 4 | 2,8 | 3,3 | 2 | 3,1 |
| Tháng 5 | 3,2 | 3,6 | 2,3 | 3,4 |
| Tháng 6 | 3,5 | 3,8 | 2,5 | 3,6 |
| Tháng 7 | 3,3 | 3,7 | 2,4 | 3,5 |
| Tháng 8 | 3,6 | 4 | 2,6 | 3,8 |
| Tháng 9 | 3,8 | 4,2 | 2,7 | 4 |
| Tháng 10 | 3,9 | 4,3 | 2,8 | 4,1 |
| Tháng 11 | 4 | 4,4 | 2,9 | 4,2 |
| Tháng 12 | 4,2 | 4,5 | 3 | 4,3 |

Bài tham khảo 1
Introduction
The line graph illustrates the monthly sales figures for four companies (A, B, C, and D) throughout the year 2022. The data is presented to highlight the variations in the number of cars sold by each company over the twelve-month period.
Overview
Overall, Company B consistently sold the highest number of cars each month, while Company C had the lowest sales figures. Additionally, all four companies showed a general upward trend in their sales from January to December.
Body 1
At the beginning of the year, Company B led the sales with 3,200 cars sold in January, followed by Company D with 2,900 cars, Company A with 2,500 cars, and Company C with 1,800 cars. As the year progressed, sales for all companies increased. By June, Company B’s sales had risen to 3,800 cars, maintaining its leading position, while Company D sold 3,600 cars, surpassing Company A’s sales of 3,500 cars. Company C also saw an increase to 2,500 cars sold.
Body 2
In the latter half of the year, the upward trend continued. By December, Company B reached its peak with 4,500 cars sold, followed by Company D with 4,300 cars, Company A with 4,200 cars, and Company C with 3,000 cars. Notably, the sales gap between Company B and the other companies widened over the year. Despite this, all four companies demonstrated significant growth in their monthly car sales, reflecting a positive market trend for the automotive industry in 2022.
Bài tham khảo 2
Introduction
The line graph illustrates the number of cars sold each month in 2022 by four different companies: Company A, Company B, Company C, and Company D. The data is given in units sold and represents monthly sales figures throughout the year.
Overview
Overall, all four companies exhibited an upward trend in car sales over the course of the year. Company A and Company B experienced the most significant increases, while Company C had the least growth. Company D consistently sold more cars than Company C but fewer than Companies A and B.
Body 1
In January, Company B led the sales with 3,200 units, followed by Company D with 2,900 units, Company A with 2,500 units, and Company C with 1,800 units. Sales for all companies gradually increased over the first half of the year. By June, Company A had reached 3,500 units, Company B 3,800 units, Company C 2,500 units, and Company D 3,600 units.
Body 2
In the second half of the year, the sales figures continued to rise. Company A’s sales peaked at 4,200 units in December, while Company B reached 4,500 units, marking the highest sales among all companies. Company D also saw a steady increase, ending the year with 4,300 units sold. Company C, despite a slower growth rate, managed to sell 3,000 units in December. Notably, Company B maintained its lead throughout the year, while Company C remained the lowest in sales.
Bài tham khảo 3
Introduction:
The line graph illustrates the monthly car sales figures of four companies (A, B, C, and D) throughout the year 2022. The data highlights the trends in the number of cars sold by each company over the twelve-month period.
Overview:
Overall, all four companies showed an upward trend in car sales over the year. Company B consistently had the highest sales each month, while Company C had the lowest. Notably, there were fluctuations in sales for each company, but the general trajectory was upward.
Body 1:
In the first quarter of 2022, Company B led the market with sales starting at 3,200 units in January and gradually increasing to 3,500 units by March. Company D followed, starting at 2,900 units in January and rising to 3,200 units in March. Company A and Company C had lower sales figures, with Company A increasing from 2,500 to 3,000 units and Company C from 1,800 to 2,100 units during the same period.
Body 2:
From April to December, the sales for all companies continued to grow. Company B’s sales peaked in December at 4,500 units, maintaining its position as the leader. Company D’s sales also showed significant growth, reaching 4,300 units in December. Company A experienced a steady increase, ending the year with 4,200 units sold. Although Company C remained the lowest, it showed consistent improvement, finishing the year at 3,000 units. This indicates a positive sales trajectory for all companies throughout the year.