IELTS Writing Task 1 yêu cầu thí sinh phân tích biểu đồ thể hiện doanh số bán ô tô từ năm 2011 đến năm 2022 của bốn quốc gia. Bài viết cần mô tả xu hướng, sự thay đổi và so sánh giữa các quốc gia. Thí sinh nên chú ý đến số liệu và sự khác biệt nổi bật để cung cấp bài phân tích chi tiết và chính xác.
Bạn có thể đọc lại bài nói về Task 1 tại đây: IELTS Writing Task 1 cần lưu ý những gì?
Bạn cũng có thể đọc thêm bài viết này vì đề bài này là IELTS Writing Task 1 biểu đồ Line Graph.
Bạn cũng có thể Xây Dựng Lộ Trình Cá Nhân Hóa của mình tại link.
IELTS Writing Task 1 Line Graph: Car Sales 2
You should spent about 20 mintutes on this task
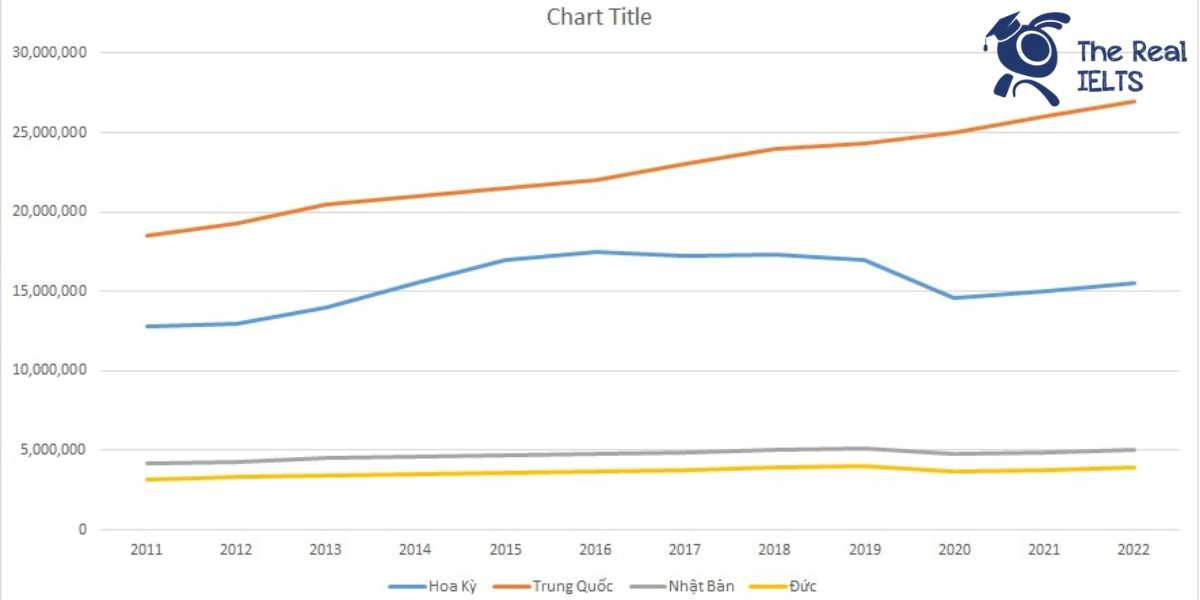
IELTS Writing Task 1 requires candidates to analyze a chart showing car sales from 2011 to 2022 in four countries. The essay should describe trends, changes, and comparisons between the countries. Candidates should pay attention to the data and notable differences to provide a detailed and accurate analysis.
You should write at least 150 words.
| Năm | Hoa Kỳ | Trung Quốc | Nhật Bản | Đức |
| 2011 | 12,800,000 | 18,500,000 | 4,200,000 | 3,200,000 |
| 2012 | 13,000,000 | 19,300,000 | 4,300,000 | 3,300,000 |
| 2013 | 14,000,000 | 20,500,000 | 4,500,000 | 3,400,000 |
| 2014 | 15,500,000 | 21,000,000 | 4,600,000 | 3,500,000 |
| 2015 | 17,000,000 | 21,500,000 | 4,700,000 | 3,600,000 |
| 2016 | 17,500,000 | 22,000,000 | 4,800,000 | 3,700,000 |
| 2017 | 17,200,000 | 23,000,000 | 4,900,000 | 3,800,000 |
| 2018 | 17,300,000 | 24,000,000 | 5,000,000 | 3,900,000 |
| 2019 | 17,000,000 | 24,300,000 | 5,100,000 | 4,000,000 |
| 2020 | 14,600,000 | 25,000,000 | 4,800,000 | 3,700,000 |
| 2021 | 15,000,000 | 26,000,000 | 4,900,000 | 3,800,000 |
| 2022 | 15,500,000 | 27,000,000 | 5,000,000 | 3,900,000 |

Bài tham khảo 1
The table provides a statistical overview of annual car sales in four countries—USA, China, Japan, and Germany—from 2011 to 2022.
Overview:
Overall, the data indicates a rising trend in car sales in all four countries, with China experiencing the most significant increase. The United States also shows substantial growth, though with some fluctuations, while Japan and Germany demonstrate steady but moderate increases.
Body 1:
In 2011, China led the market with 18.5 million car sales, followed by the USA at 12.8 million. Japan and Germany had significantly lower figures, with 4.2 million and 3.2 million, respectively. Over the years, car sales in China continuously rose, reaching a peak of 27 million in 2022. The USA also saw a general increase, peaking at 17.5 million in 2016 before experiencing minor declines and fluctuations, finally recording 15.5 million in 2022.
Body 2:
Japan’s car sales showed a gradual rise from 4.2 million in 2011 to 5 million in 2022, with a slight dip in 2020. Germany followed a similar trend, with sales increasing from 3.2 million in 2011 to 3.9 million in 2022. Despite the overall growth, Germany experienced a small setback in 2020, paralleling global economic impacts likely due to the COVID-19 pandemic.
In conclusion, while all four countries saw an upward trend in car sales over the given period, China and the USA exhibited the most significant growth, with China maintaining its lead throughout the years. Japan and Germany, although growing at a slower pace, showed consistent increases, reflecting a stable market in these countries.
Bài tham khảo 2
Introduction
The table illustrates the annual car sales figures in four countries— the United States, China, Japan, and Germany— from 2011 to 2022.
Overview
Overall, China consistently had the highest car sales throughout the period, followed by the United States. Japan and Germany had significantly lower sales compared to the other two countries. Notably, while China’s car sales showed a steady increase, the sales in the United States and Japan fluctuated more. Germany had the most stable and gradual growth.
Body 1
In 2011, China had the highest car sales at 18.5 million units, which steadily increased to 27 million units by 2022. The United States followed with sales starting at 12.8 million in 2011, peaking at 17.5 million in 2016, and then slightly declining before reaching 15.5 million in 2022. Japan’s sales figures were relatively stable, starting at 4.2 million in 2011 and slightly increasing to 5 million by 2022, despite minor fluctuations.
Body 2
Germany had the lowest car sales among the four countries, beginning with 3.2 million in 2011 and gradually rising to 3.9 million in 2022. The period between 2011 and 2019 saw a consistent increase in car sales across all four countries, but the global pandemic in 2020 led to a significant drop in the United States and Japan’s figures. However, by 2022, the car sales in these countries showed signs of recovery, although they had not returned to their pre-pandemic peaks.
Bài tham khảo 3
Introduction
The table provides data on annual car sales in four countries, namely the USA, China, Japan, and Germany, over a twelve-year period from 2011 to 2022.
Overview
Overall, China consistently had the highest car sales throughout the period, followed by the USA, Japan, and Germany. While all four countries saw fluctuations in sales, China and the USA experienced significant growth, whereas Japan and Germany had more modest increases.
Body 1
In 2011, car sales in China were the highest at 18.5 million units, while the USA followed with 12.8 million. Japan and Germany had significantly lower sales, with 4.2 million and 3.2 million units, respectively. Over the next few years, both China and the USA saw substantial increases. By 2015, sales in China reached 21.5 million, while the USA’s sales grew to 17 million units. In contrast, Japan and Germany’s growth was steadier, with Japan reaching 4.7 million and Germany 3.6 million units in the same year.
Body 2
From 2016 to 2022, China continued to lead with its car sales rising to 27 million units by 2022. The USA also showed an upward trend, peaking at 17.5 million units in 2016 but then fluctuating slightly before ending at 15.5 million in 2022. Japan’s car sales increased steadily to 5 million units by 2022, despite a slight dip in 2020. Germany’s sales also followed a gradual upward trend, ending at 3.9 million units in 2022. Notably, all countries experienced a decline in sales in 2020, likely due to the global pandemic, but rebounded in the following years.
Bài tham khảo 4
Introduction
The table provides a detailed overview of annual car sales in four countries: the United States, China, Japan, and Germany, from 2011 to 2022.
Overview
Overall, car sales in all four countries show an upward trend over the period, with China consistently leading in sales volume. Notably, the United States experienced fluctuations, particularly a significant drop in 2020. Japan and Germany showed steady, moderate growth throughout the years.
Body 1
In 2011, China had the highest car sales at 18.5 million, which increased to 27 million by 2022. This represents a growth of approximately 46%. In comparison, the United States saw its sales increase from 12.8 million in 2011 to a peak of 17.5 million in 2016. However, sales dropped sharply to 14.6 million in 2020 before recovering to 15.5 million by 2022.
Body 2
Japan’s car sales rose from 4.2 million in 2011 to 5 million in 2022, showing a consistent but slower growth rate compared to China and the United States. Germany also exhibited steady growth, with sales increasing from 3.2 million in 2011 to 3.9 million in 2022. Despite the steady increase in sales, both Japan and Germany had significantly lower sales volumes compared to China and the United States throughout the period.
Overall, the data highlights the dominant position of China in the global car market and the varying trends in car sales in the United States, Japan, and Germany.