IELTS Writing Task 1 Line Graph: Biểu đồ đường thể hiện mức độ CO2 cho thấy sự biến đổi về lượng khí thải carbon dioxide qua các năm. Dữ liệu được phân tích theo các mốc thời gian cụ thể, giúp người đọc dễ dàng nhận thấy xu hướng tăng hoặc giảm của mức độ CO2, từ đó đánh giá tác động đến môi trường và sức khỏe.
Bạn có thể đọc lại bài nói về Task 1 tại đây: IELTS Writing Task 1 cần lưu ý những gì?
Bạn cũng có thể đọc thêm bài viết này vì đề bài này là IELTS Writing Task 1 biểu đồ Line Graph.
IELTS Writing Task 1 Line Graph: CO2 levels
You should spent about 20 mintutes on this task
IELTS Writing Task 1 Line Graph: The line graph depicting CO2 levels shows the variations in carbon dioxide emissions over the years. The data is analyzed at specific time intervals, allowing readers to easily observe the increasing or decreasing trends of CO2 levels, thereby assessing the impact on the environment and health.
You should write at least 150 words.
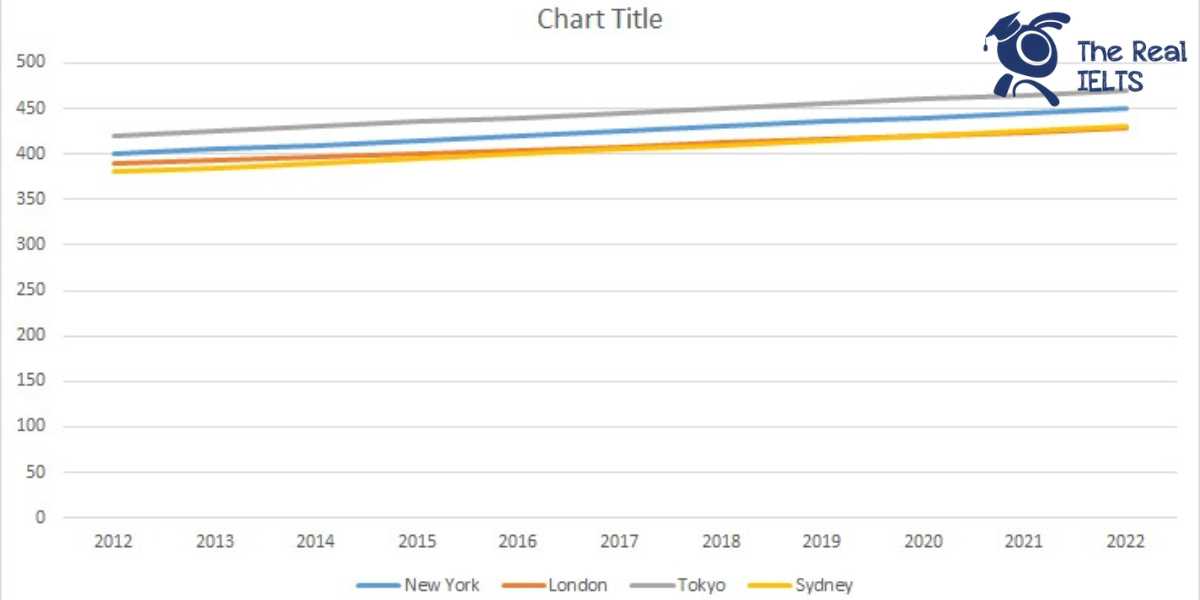
| Năm | New York | London | Tokyo | Sydney |
| 2012 | 400 | 390 | 420 | 380 |
| 2013 | 405 | 393 | 425 | 385 |
| 2014 | 410 | 397 | 430 | 390 |
| 2015 | 415 | 400 | 435 | 395 |
| 2016 | 420 | 404 | 440 | 400 |
| 2017 | 425 | 408 | 445 | 405 |
| 2018 | 430 | 412 | 450 | 410 |
| 2019 | 435 | 416 | 455 | 415 |
| 2020 | 440 | 420 | 460 | 420 |
| 2021 | 445 | 424 | 465 | 425 |
| 2022 | 450 | 428 | 470 | 430 |

Bài Writing tham khảo 1
The line graph illustrates the population growth in four major cities—New York, London, Tokyo, and Sydney—over a period of 11 years from 2012 to 2022.
Overall, all four cities experienced a steady increase in population throughout the period. Tokyo consistently had the highest population, followed by New York, London, and Sydney.
In 2012, Tokyo had the largest population at 420, while Sydney had the smallest at 380. Over the next decade, Tokyo’s population grew steadily, reaching 470 by 2022. New York also showed a consistent upward trend, starting at 400 in 2012 and increasing to 450 in 2022. Similarly, London’s population rose from 390 in 2012 to 428 in 2022.
Sydney, although it started with the smallest population among the four cities, showed a gradual increase as well. In 2012, its population was 380, and by 2022, it had risen to 430, mirroring the steady growth seen in the other cities.
In conclusion, the line graph reveals that all four cities saw continuous population growth over the given period, with Tokyo maintaining its position as the most populous city, and Sydney experiencing the least population growth but still showing a significant upward trend.
Bài Writing tham khảo 2
The line graph illustrates the population growth in four cities – New York, London, Tokyo, and Sydney – from 2012 to 2022.
Overall, all four cities experienced a steady increase in population over the 10-year period. Tokyo consistently had the highest population throughout the years, while Sydney had the lowest, despite both showing similar upward trends.
In 2012, Tokyo had the largest population at 420, followed by New York at 400, London at 390, and Sydney at 380. Over the years, Tokyo’s population grew significantly, reaching 470 in 2022. This consistent increase saw Tokyo maintain its leading position in population size.
Similarly, New York’s population rose from 400 in 2012 to 450 in 2022. Although London and Sydney started with lower populations than New York, they also showed gradual increases. By 2022, London’s population had grown from 390 to 428, while Sydney’s population rose from 380 to 430, overtaking London in the final year.
In conclusion, the data clearly indicates a consistent upward trend in the populations of all four cities over the decade, with Tokyo maintaining the highest population and Sydney showing the most notable growth relative to its starting point.
Bài Writing tham khảo 3
The line graph illustrates the annual average temperatures in four cities—New York, London, Tokyo, and Sydney—over the period from 2012 to 2022.
Overall, all four cities experienced a steady increase in their average temperatures throughout the observed period. Notably, Tokyo consistently recorded the highest temperatures, while Sydney had the lowest among the four cities by the end of the period.
In 2012, the average temperature in Tokyo was 420, which was the highest among the four cities. New York followed with 400, then London with 390, and Sydney with 380. By 2017, all cities had seen an increase in their average temperatures, with Tokyo reaching 445, New York 425, London 408, and Sydney 405.
From 2018 onwards, the upward trend continued for all cities. By 2022, Tokyo’s temperature peaked at 470, maintaining its position as the city with the highest temperature. New York’s average temperature rose to 450, London reached 428, and Sydney’s temperature climbed to 430, surpassing London by 2 degrees.
In summary, despite the steady rise in temperatures across all cities, Tokyo remained the warmest city throughout the period, while Sydney, which initially had the lowest temperatures, surpassed London in the final years.