Biểu đồ đường minh họa số ca mắc COVID-19 tại ba quốc gia từ tháng 1 đến tháng 12 năm 2020. Trong bài thi IELTS Writing Task 1 này, người viết cần mô tả xu hướng, so sánh dữ liệu và nêu bật những điểm đáng chú ý về sự biến động của các ca nhiễm qua từng thời điểm.
Bạn có thể đọc lại bài nói về Task 1 tại đây: IELTS Writing Task 1 cần lưu ý những gì?
Bạn cũng có thể đọc thêm bài viết này vì đề bài này là IELTS Writing Task 1 biểu đồ Line Graph.
IELTS Writing Task 1 Line Graph: COVID-19
You should spent about 20 mintutes on this task
The line graph illustrates the number of COVID-19 cases in three countries from January to December 2020. In this IELTS Writing Task 1, the writer needs to describe trends, compare data, and highlight notable points regarding the fluctuations in the number of cases over different time periods.
You should write at least 150 words.
| Date | City_A | City_B | City_C | City_D |
| 2021-09-01 | 172 | 265 | 459 | 430 |
| 2021-09-02 | 47 | 404 | 370 | 82 |
| 2021-09-03 | 117 | 115 | 183 | 91 |
| 2021-09-04 | 192 | 464 | 28 | 384 |
| 2021-09-05 | 323 | 243 | 290 | 398 |
| 2021-09-06 | 251 | 497 | 181 | 435 |
| 2021-09-07 | 195 | 315 | 456 | 197 |
| 2021-09-08 | 259 | 134 | 444 | 316 |
| 2021-09-09 | 379 | 294 | 342 | 228 |
| 2021-09-10 | 289 | 232 | 263 | 14 |
| 2021-09-11 | 441 | 64 | 493 | 138 |
| 2021-09-12 | 124 | 375 | 396 | 358 |
| 2021-09-13 | 156 | 331 | 15 | 190 |
| 2021-09-14 | 214 | 334 | 366 | 235 |
| 2021-09-15 | 343 | 152 | 216 | 128 |
| 2021-09-16 | 102 | 393 | 38 | 352 |
| 2021-09-17 | 247 | 455 | 349 | 493 |
| 2021-09-18 | 153 | 153 | 297 | 223 |
| 2021-09-19 | 289 | 226 | 288 | 188 |
| 2021-09-20 | 300 | 484 | 16 | 312 |
| 2021-09-21 | 198 | 274 | 311 | 488 |
| 2021-09-22 | 348 | 488 | 151 | 354 |
| 2021-09-23 | 273 | 391 | 372 | 49 |
| 2021-09-24 | 298 | 400 | 462 | 372 |
| 2021-09-25 | 255 | 122 | 42 | 260 |
| 2021-09-26 | 238 | 86 | 7 | 191 |
| 2021-09-27 | 282 | 154 | 429 | 122 |
| 2021-09-28 | 177 | 423 | 353 | 455 |
| 2021-09-29 | 352 | 228 | 114 | 383 |
| 2021-09-30 | 291 | 208 | 301 | 49 |

Bài Writing tham khảo 1
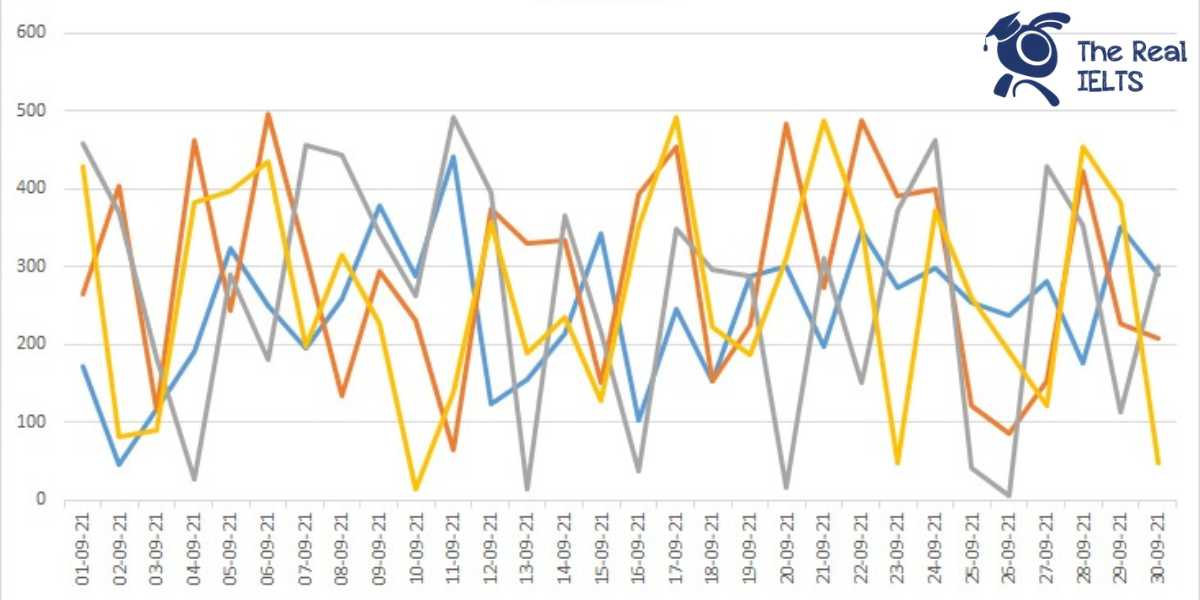
The line graph illustrates the daily number of COVID-19 cases reported in four cities (City A, City B, City C, and City D) throughout September 2021.
Overview: Overall, the daily COVID-19 cases fluctuated significantly across all four cities over the month. City B consistently reported high numbers, whereas City C experienced the most dramatic variations. City A and City D showed relatively moderate fluctuations in daily cases.
Body 1: City A started the month with 172 cases and saw various ups and downs, peaking at 441 cases on September 11th and dipping to its lowest at 47 cases on September 2nd. City B, which began with 265 cases, recorded its highest number of cases (497) on September 6th and saw a significant drop to 64 cases on September 11th. By the end of the month, City B’s cases had risen back to 400.
Body 2: City C’s daily cases ranged widely, from a high of 493 cases on September 11th to a low of 7 cases on September 26th. This city experienced some of the most pronounced day-to-day changes among the four cities. In contrast, City D had a less erratic pattern but still varied considerably, starting with 430 cases and seeing its highest count of 493 on September 17th, before decreasing sharply to 14 cases on September 10th. By the end of September, City D reported 49 cases.
In conclusion, the data highlights the volatile nature of COVID-19 case counts across different cities, reflecting the unpredictable spread of the virus during September 2021.
Bài Writing tham khảo 2
The line graph illustrates the daily number of COVID-19 cases reported in four cities (City A, City B, City C, and City D) throughout September 2021.
Overview: Overall, the number of COVID-19 cases fluctuated significantly across all four cities during the month. City B and City D experienced the most noticeable variations, while City C saw several sharp peaks. City A had relatively fewer extreme fluctuations compared to the other cities.
Body 1: City A started with 172 cases on September 1st, then experienced a significant drop to 47 cases by September 2nd. Following this, the numbers fluctuated but generally trended upwards, reaching peaks on September 11th (441 cases) and September 22nd (348 cases). The month ended with a moderate number of 291 cases on September 30th. City B, on the other hand, began with a higher number of cases at 265 on September 1st, rising to a peak of 497 cases by September 6th. After several ups and downs, it reached another peak of 488 cases on September 22nd, and concluded the month with 208 cases on September 30th.
Body 2: City C displayed a highly variable pattern, starting with 459 cases on September 1st, then dropping to 28 cases by September 4th. The numbers soared again, hitting a high of 493 cases on September 11th. Despite some fluctuations, the trend in City C generally saw a decline towards the end of the month, with a few notable spikes such as on September 27th (429 cases). City D, similar to City B, had significant fluctuations.
Beginning with 430 cases on September 1st, it saw a major decrease to 82 cases by September 2nd, then peaked at 493 cases on September 17th. The city experienced several peaks and troughs before ending the month with a relatively low count of 49 cases on September 30th.
In summary, all four cities demonstrated substantial variability in daily COVID-19 cases throughout September 2021, with City B and City D showing the highest fluctuations.
Bài Writing tham khảo 3
Introduction
The line graph illustrates the number of daily COVID-19 cases reported in four cities (City A, City B, City C, and City D) throughout September 2021.
Overview
Overall, the trends in COVID-19 cases varied significantly among the four cities over the given period. City B and City D experienced considerable fluctuations in daily cases, while City A and City C showed more moderate variations. Notably, City B recorded the highest number of daily cases on multiple occasions.
Body 1
In the first half of the month, City A’s cases ranged from a low of 47 on September 2 to a high of 441 on September 11. There was a significant spike on September 5 with 323 cases and another peak on September 11. City B, on the other hand, started with 265 cases on September 1, reached its peak on September 6 with 497 cases, and saw another notable increase on September 17 with 455 cases.
City C’s daily cases were initially high, with 459 cases on September 1. This number decreased dramatically to 28 on September 4. However, there were subsequent increases, with notable peaks of 493 on September 11 and 462 on September 24. City D began the month with 430 cases, saw a significant drop to 82 on September 2, and experienced another drop to 14 cases on September 10. However, this city also witnessed peaks such as 493 cases on September 17 and 455 on September 28.
Body 2
In the latter half of September, City A maintained a relatively stable trend with minor fluctuations, peaking at 352 cases on September 29. City B showed more pronounced variations, reaching its highest daily count for the month at 488 cases on both September 22 and September 30.
City C had fewer cases in the second half, with significant drops, such as 7 cases on September 26, and moderate peaks, including 429 on September 27. City D’s cases continued to fluctuate, with a notable rise to 455 on September 28 and a significant decrease to 49 on September 23 and 30.
In summary, while all cities experienced fluctuations in COVID-19 cases throughout September 2021, City B consistently recorded the highest daily numbers, and City C saw significant decreases by the month’s end.