IELTS Writing Task 1 yêu cầu mô tả biểu đồ về tỷ lệ mắc bệnh tiểu đường hàng tháng trong năm 2021 theo 4 độ tuổi khác nhau. Nhiệm vụ của thí sinh là phân tích và so sánh các số liệu thống kê, xác định xu hướng và những điểm đáng chú ý, đồng thời trình bày một cách rõ ràng và logic.
Bạn có thể đọc lại bài nói về Task 1 tại đây: IELTS Writing Task 1 cần lưu ý những gì?
Bạn cũng có thể đọc thêm bài viết này vì đề bài này là IELTS Writing Task 1 biểu đồ Line Graph.
Bạn cũng có thể Xây Dựng Lộ Trình Cá Nhân Hóa của mình tại link.
IELTS Writing Task 1 Line Graph: Diabetes Rates
You should spent about 20 mintutes on this task
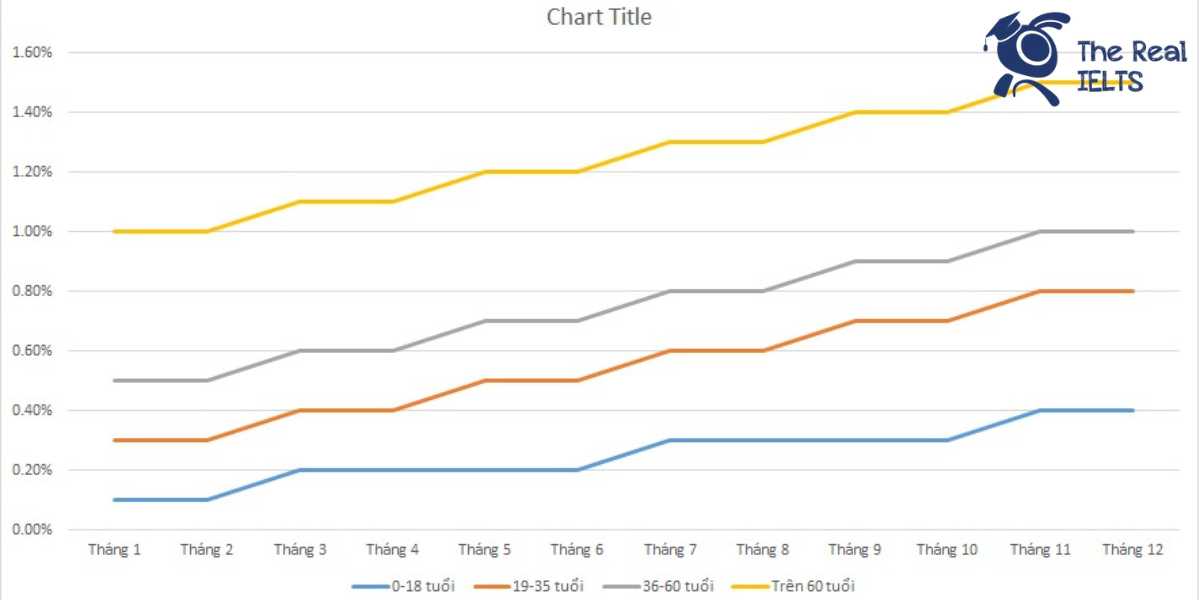
IELTS Writing Task 1 requires describing a chart about the monthly diabetes rates in 2021 across four different age groups. The candidate’s task is to analyze and compare the statistics, identify trends and notable points, and present them clearly and logically.
You should write at least 150 words.
| Tháng | 0-18 tuổi | 19-35 tuổi | 36-60 tuổi | Trên 60 tuổi |
| Tháng 1 | 0.10% | 0.30% | 0.50% | 1.00% |
| Tháng 2 | 0.10% | 0.30% | 0.50% | 1.00% |
| Tháng 3 | 0.20% | 0.40% | 0.60% | 1.10% |
| Tháng 4 | 0.20% | 0.40% | 0.60% | 1.10% |
| Tháng 5 | 0.20% | 0.50% | 0.70% | 1.20% |
| Tháng 6 | 0.20% | 0.50% | 0.70% | 1.20% |
| Tháng 7 | 0.30% | 0.60% | 0.80% | 1.30% |
| Tháng 8 | 0.30% | 0.60% | 0.80% | 1.30% |
| Tháng 9 | 0.30% | 0.70% | 0.90% | 1.40% |
| Tháng 10 | 0.30% | 0.70% | 0.90% | 1.40% |
| Tháng 11 | 0.40% | 0.80% | 1.00% | 1.50% |
| Tháng 12 | 0.40% | 0.80% | 1.00% | 1.50% |

Bài tham khảo 1
Introduction
The table provides a detailed breakdown of the monthly diabetes prevalence rates across different age groups in the year 2021. The age groups analyzed include individuals aged 0-18, 19-35, 36-60, and those over 60 years old.
Overview
Overall, the data indicates that the prevalence of diabetes increases with age. Additionally, there is a consistent rise in diabetes rates across all age groups as the year progresses, with the highest rates observed in December.
Body 1
For the age group 0-18, the diabetes rate starts at 0.1% in January and February, gradually increasing to 0.4% by December. The 19-35 age group exhibits a similar pattern, beginning at 0.3% in the initial months and reaching 0.8% in the final months of the year.
Body 2
In the 36-60 age group, the rate begins at 0.5% in January and February, incrementally rising to 1.0% by December. The highest prevalence is noted in the over 60 age group, starting at 1.0% in the early months and peaking at 1.5% by the end of the year. This data underscores a clear trend of increasing diabetes prevalence with advancing age and over time within the year 2021.
Bài tham khảo 2
Introduction
The table illustrates the monthly percentage of diabetes incidence in the year 2021, categorized by four different age groups: 0-18 years, 19-35 years, 36-60 years, and over 60 years. The figures provided are hypothetical.
Overview
Overall, the data shows an upward trend in the incidence of diabetes across all age groups as the year progresses. The highest percentages of diabetes cases are consistently found in the over 60 age group, while the 0-18 age group shows the lowest incidence rates throughout the year.
Body 1
In the first half of the year, the 0-18 age group maintains a relatively stable rate of diabetes at 0.1% for January and February, which slightly increases to 0.2% from March to June. The 19-35 age group shows a similar trend, starting at 0.3% in the first two months and increasing to 0.4% by March and April, then further to 0.5% in May and June. The 36-60 age group starts at 0.5% in January and February, rising to 0.6% from March to April and reaching 0.7% by May and June. The over 60 age group starts at 1.0% in January and February, increasing gradually to 1.1% by March and April, and 1.2% by May and June.
Body 2
In the latter half of the year, the trend of increasing diabetes incidence continues. The 0-18 age group increases to 0.3% in July through October, and finally 0.4% in November and December. The 19-35 age group rises to 0.6% in July and August, further increasing to 0.7% in September and October, and peaking at 0.8% in the last two months of the year. The 36-60 age group experiences a rise to 0.8% in July and August, 0.9% in September and October, and finally 1.0% in November and December. The over 60 age group continues to have the highest incidence, reaching 1.3% in July and August, 1.4% in September and October, and 1.5% in the final two months of the year.
Conclusion
The data indicates that the incidence of diabetes increases consistently across all age groups as the year progresses, with older age groups showing higher rates of diabetes throughout the year.
Bài tham khảo 3
The table illustrates the monthly diabetes rates in 2021 for four different age groups: 0-18 years, 19-35 years, 36-60 years, and over 60 years. The data provided is hypothetical.
Overview: Overall, the diabetes rates increase gradually across all age groups over the year. The older age groups consistently show higher diabetes rates compared to the younger age groups, with the highest rates observed in the over 60 age group.
Body 1: From January to December, the 0-18 age group shows the lowest diabetes rates, starting at 0.1% in the first two months and rising steadily to 0.4% by the end of the year. Similarly, the 19-35 age group starts with a rate of 0.3% in January and February, gradually increasing to 0.8% in November and December.
Body 2: The 36-60 age group and the over 60 age group have higher initial diabetes rates. For the 36-60 age group, the rate starts at 0.5% in January and February, climbing to 1.0% by November and December. The over 60 age group has the highest starting rate at 1.0% in the first two months, with a gradual increase to 1.5% by the end of the year. Both these age groups experience consistent increases in diabetes rates throughout the year.
In summary, the data indicates that diabetes rates are positively correlated with age, with higher age groups experiencing higher rates of diabetes. The rates also show a steady increase throughout the year for all age groups.
Bài tham khảo 4
Introduction
The table illustrates the monthly diabetes incidence rates in 2021 for four different age groups: 0-18 years, 19-35 years, 36-60 years, and over 60 years. The data provided is hypothetical.
Overview
Overall, the incidence rates of diabetes increase consistently across all age groups throughout the year. The older the age group, the higher the incidence rate observed.
Body 1
From January to December, the diabetes incidence rates for the youngest age group (0-18 years) start at 0.1% and gradually increase to 0.4%. Similarly, the 19-35 age group begins the year with an incidence rate of 0.3% and reaches 0.8% by the end of the year. This trend indicates a steady rise in the number of diabetes cases as the year progresses.
Body 2
In the 36-60 age group, the incidence rate starts at 0.5% in January and climbs to 1.0% by December. The over 60 age group shows the highest incidence rates, beginning at 1.0% in January and peaking at 1.5% in December. This pattern reflects that older age groups are more prone to diabetes, with the over 60 age group experiencing the most significant increase over the year.