IELTS Writing Task 1 yêu cầu thí sinh mô tả biểu đồ về số lượng học sinh nhập học hàng năm từ năm 2011 đến năm 2022. Biểu đồ thể hiện xu hướng tăng giảm trong suốt 12 năm, giúp thí sinh luyện tập kỹ năng phân tích và diễn đạt thông tin theo cách rõ ràng và logic.
Bạn có thể đọc lại bài nói về Task 1 tại đây: IELTS Writing Task 1 cần lưu ý những gì?
Bạn cũng có thể đọc thêm bài viết này vì đề bài này là IELTS Writing Task 1 biểu đồ Line Graph.
Bạn cũng có thể Xây Dựng Lộ Trình Cá Nhân Hóa của mình tại link.
IELTS Writing Task 1 Line Graph: Students Enrolling
You should spent about 20 mintutes on this task
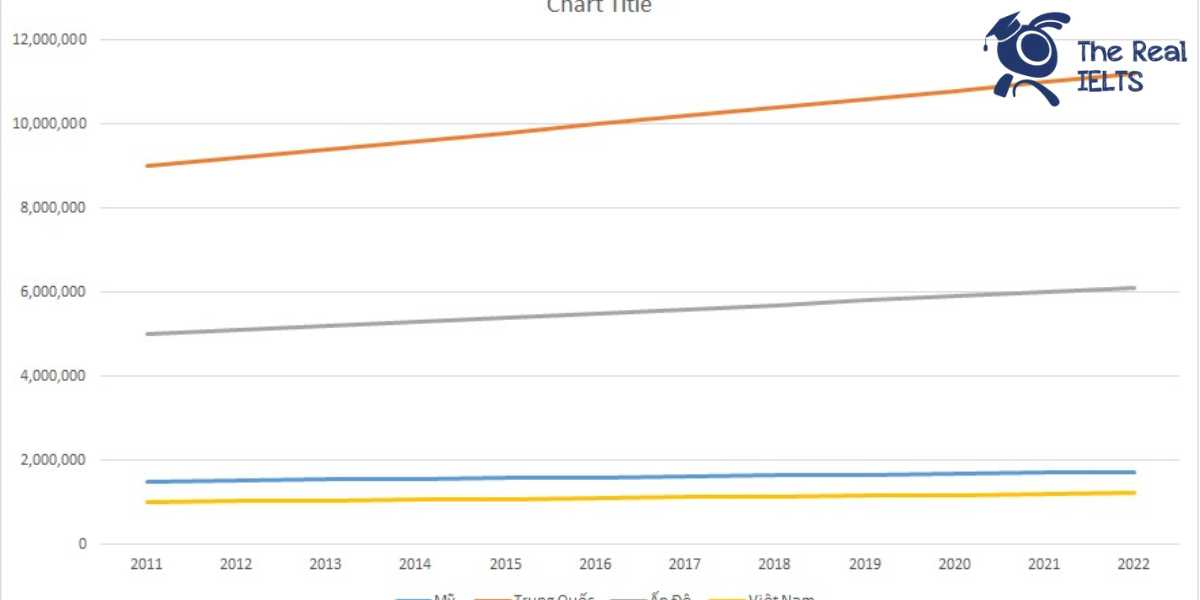
IELTS Writing Task 1 requires candidates to describe a chart about the number of students enrolling annually from 2011 to 2022. The chart shows the trends of increase and decrease over the 12 years, helping candidates practice their skills in analyzing and presenting information clearly and logically.
You should write at least 150 words.
| Năm | Mỹ | Trung Quốc | Ấn Độ | Việt Nam |
| 2011 | 1,500,000 | 9,000,000 | 5,000,000 | 1,000,000 |
| 2012 | 1,520,000 | 9,200,000 | 5,100,000 | 1,020,000 |
| 2013 | 1,540,000 | 9,400,000 | 5,200,000 | 1,040,000 |
| 2014 | 1,560,000 | 9,600,000 | 5,300,000 | 1,060,000 |
| 2015 | 1,580,000 | 9,800,000 | 5,400,000 | 1,080,000 |
| 2016 | 1,600,000 | 10,000,000 | 5,500,000 | 1,100,000 |
| 2017 | 1,620,000 | 10,200,000 | 5,600,000 | 1,120,000 |
| 2018 | 1,640,000 | 10,400,000 | 5,700,000 | 1,140,000 |
| 2019 | 1,660,000 | 10,600,000 | 5,800,000 | 1,160,000 |
| 2020 | 1,680,000 | 10,800,000 | 5,900,000 | 1,180,000 |
| 2021 | 1,700,000 | 11,000,000 | 6,000,000 | 1,200,000 |
| 2022 | 1,720,000 | 11,200,000 | 6,100,000 | 1,220,000 |

Bài tham khảo 1
Introduction
The table illustrates the number of students enrolling annually from 2011 to 2022 in four countries: the United States, China, India, and Vietnam.
Overview
Overall, all four countries experienced a steady increase in the number of student enrollments over the 12-year period. China had the highest number of students each year, while Vietnam had the lowest.
Body 1
In 2011, the United States had 1,500,000 students, which gradually increased by 20,000 each year, reaching 1,720,000 in 2022. Similarly, India started with 5,000,000 students in 2011, increasing by 100,000 annually, reaching 6,100,000 in 2022.
Body 2
China had the largest number of students, beginning with 9,000,000 in 2011 and increasing consistently by 200,000 each year to reach 11,200,000 in 2022. Vietnam, while having the lowest numbers, also showed growth from 1,000,000 in 2011 to 1,220,000 in 2022, with an annual increase of 20,000.
This data highlights the overall trend of rising student enrollments in all four countries over the given period.
Bài tham khảo 2
Introduction
The table provides data on the annual number of students enrolled in four countries (USA, China, India, and Vietnam) from 2011 to 2022.
Overview
Overall, the number of students enrolled increased steadily in all four countries over the twelve-year period. China had the highest enrollment figures throughout, while Vietnam had the lowest.
Body 1
In 2011, China led with 9 million students, significantly higher than India’s 5 million, the USA’s 1.5 million, and Vietnam’s 1 million. By 2016, these numbers had grown, with China reaching 10 million, India at 5.5 million, the USA at 1.6 million, and Vietnam at 1.1 million. This consistent increase in enrollments indicates a growing emphasis on education across all four nations.
Body 2
From 2017 to 2022, the upward trend continued. By 2022, China’s student enrollment had risen to 11.2 million, while India saw an increase to 6.1 million. The USA’s enrollment figures reached 1.72 million, and Vietnam’s climbed to 1.22 million. The steady growth in student numbers highlights the ongoing expansion of educational opportunities and infrastructure in these countries.
Bài tham khảo 3
Introduction
The table illustrates the monthly diabetes incidence rates in 2021 for four different age groups: 0-18 years, 19-35 years, 36-60 years, and over 60 years. The data provided is hypothetical.
Overview
Overall, the incidence rates of diabetes increase consistently across all age groups throughout the year. The older the age group, the higher the incidence rate observed.
Body 1
From January to December, the diabetes incidence rates for the youngest age group (0-18 years) start at 0.1% and gradually increase to 0.4%. Similarly, the 19-35 age group begins the year with an incidence rate of 0.3% and reaches 0.8% by the end of the year. This trend indicates a steady rise in the number of diabetes cases as the year progresses.
Body 2
In the 36-60 age group, the incidence rate starts at 0.5% in January and climbs to 1.0% by December. The over 60 age group shows the highest incidence rates, beginning at 1.0% in January and peaking at 1.5% in December. This pattern reflects that older age groups are more prone to diabetes, with the over 60 age group experiencing the most significant increase over the year.
Bài tham khảo 4
Introduction
The table provides data on the annual number of students enrolled in four countries (USA, China, India, and Vietnam) from 2011 to 2022.
Overview
Overall, the number of students enrolled increased steadily in all four countries over the twelve-year period. China had the highest enrollment figures throughout, while Vietnam had the lowest.
Body 1
In 2011, China led with 9 million students, significantly higher than India’s 5 million, the USA’s 1.5 million, and Vietnam’s 1 million. By 2016, these numbers had grown, with China reaching 10 million, India at 5.5 million, the USA at 1.6 million, and Vietnam at 1.1 million. This consistent increase in enrollments indicates a growing emphasis on education across all four nations.
Body 2
From 2017 to 2022, the upward trend continued. By 2022, China’s student enrollment had risen to 11.2 million, while India saw an increase to 6.1 million. The USA’s enrollment figures reached 1.72 million, and Vietnam’s climbed to 1.22 million. The steady growth in student numbers highlights the ongoing expansion of educational opportunities and infrastructure in these countries.