IELTS Writing Task 1 yêu cầu phân tích biểu đồ thể hiện lượng tiêu thụ xăng dầu hàng tháng trong năm 2012 của bốn quốc gia. Thí sinh cần miêu tả xu hướng, so sánh số liệu giữa các nước, và đưa ra nhận xét về sự biến đổi trong suốt năm. Bài viết nên rõ ràng, mạch lạc và có cấu trúc logic.
Bạn có thể đọc lại bài nói về Task 1 tại đây: IELTS Writing Task 1 cần lưu ý những gì?
Bạn cũng có thể đọc thêm bài viết này vì đề bài này là IELTS Writing Task 1 biểu đồ Line Graph.
IELTS Writing Task 1 Line Graph: Gasoline
You should spent about 20 mintutes on this task
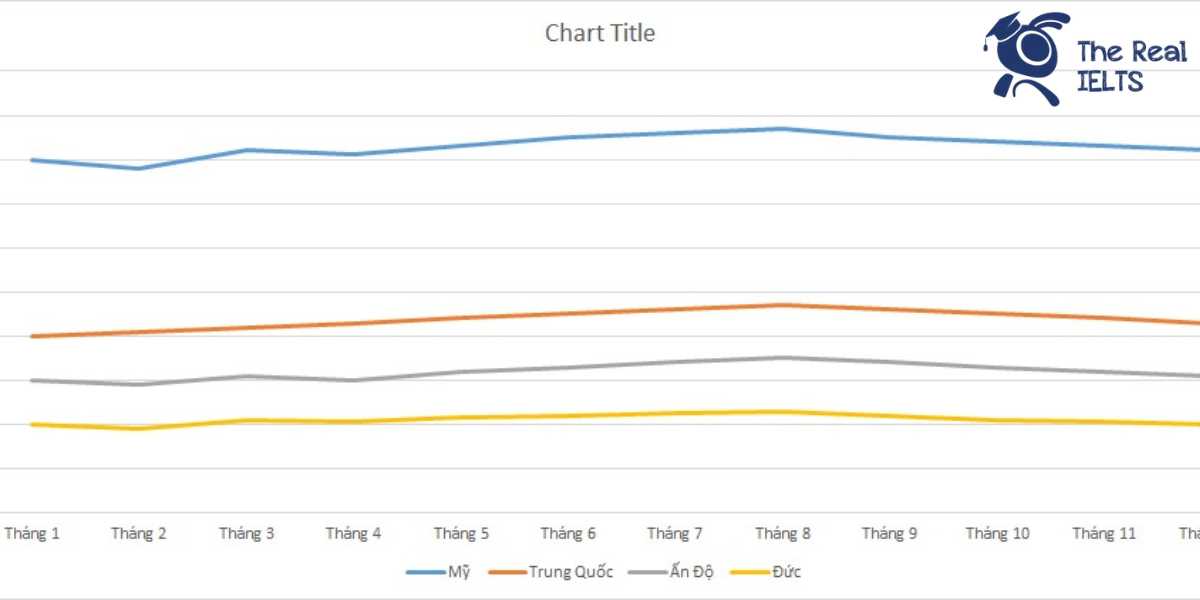
IELTS Writing Task 1 requires analyzing a chart showing the monthly gasoline consumption in 2012 of four countries. Candidates need to describe trends, compare figures between countries, and comment on the changes throughout the year. The writing should be clear, coherent, and logically structured.
You should write at least 150 words.
| Tháng | Mỹ | Trung Quốc | Ấn Độ | Đức |
| Tháng 1 | 800 | 400 | 300 | 200 |
| Tháng 2 | 780 | 410 | 290 | 190 |
| Tháng 3 | 820 | 420 | 310 | 210 |
| Tháng 4 | 810 | 430 | 300 | 205 |
| Tháng 5 | 830 | 440 | 320 | 215 |
| Tháng 6 | 850 | 450 | 330 | 220 |
| Tháng 7 | 860 | 460 | 340 | 225 |
| Tháng 8 | 870 | 470 | 350 | 230 |
| Tháng 9 | 850 | 460 | 340 | 220 |
| Tháng 10 | 840 | 450 | 330 | 210 |
| Tháng 11 | 830 | 440 | 320 | 205 |
| Tháng 12 | 820 | 430 | 310 | 200 |

Bài tham khảo 1
Introduction
The line graph illustrates the monthly oil consumption in 2012 for four hypothetical countries: the USA, China, India, and Germany. The data is measured in million barrels per month.
Overview
Overall, the USA consistently consumed the most oil throughout the year, while Germany had the lowest consumption. Both China and India showed a steady increase in oil usage over the months.
Body 1
In January, the USA’s oil consumption was the highest at 800 million barrels per month, which gradually increased to 870 million barrels in August before declining slightly to 820 million barrels in December. China started with 400 million barrels in January and experienced a consistent rise, peaking at 470 million barrels in August, and then decreasing to 430 million barrels by the end of the year.
Body 2
India’s oil consumption began at 300 million barrels in January and steadily increased to 350 million barrels in August. It then mirrored China’s pattern by declining to 310 million barrels in December. Germany, having the lowest consumption among the four countries, started with 200 million barrels in January, peaked at 230 million barrels in August, and returned to its initial level of 200 million barrels in December.
Bài tham khảo 2
The line graph illustrates the monthly oil consumption of four countries: the USA, China, India, and Germany, in 2012. The data is measured in million barrels per month.
Overall, it is clear that the USA consistently consumed the highest amount of oil throughout the year, while Germany had the lowest consumption. Additionally, all countries except the USA showed a general increase in oil consumption over the year.
In the first quarter, the USA’s oil consumption fluctuated between 780 and 820 million barrels per month, starting at 800 million barrels in January and peaking at 820 million barrels in March. From April to July, the consumption steadily increased from 810 to 860 million barrels. The highest consumption was in August at 870 million barrels, after which it slightly declined to end the year at 820 million barrels in December.
China, India, and Germany displayed similar upward trends in oil consumption. China started at 400 million barrels in January and gradually increased to 470 million barrels in August before experiencing a slight decline to 430 million barrels in December. India’s consumption rose from 300 million barrels in January to 350 million barrels in August, then decreased to 310 million barrels by December. Germany, with the lowest consumption, increased from 200 million barrels in January to 230 million barrels in August before reducing to 200 million barrels in December.
In summary, while the USA’s oil consumption fluctuated, it remained the highest among the four countries. China, India, and Germany showed steady increases, with minor declines towards the end of the year.
Bài tham khảo 3
Introduction
The line graph illustrates the monthly oil consumption in 2012 across four hypothetical countries: the USA, China, India, and Germany. The data is presented in millions of barrels per month.
Overview
Overall, the USA consistently consumed the most oil throughout the year, followed by China, India, and Germany. While the USA and China showed a general upward trend in oil consumption, India and Germany experienced more fluctuations.
Body 1
In January, the USA’s oil consumption started at 800 million barrels, rising to a peak of 870 million barrels in August. After this peak, the consumption gradually decreased to 820 million barrels by December. Similarly, China’s oil consumption began at 400 million barrels in January, increasing steadily to 470 million barrels in August. Post-August, China saw a slight decline, ending the year at 430 million barrels in December.
Body 2
India’s oil consumption began at 300 million barrels in January, reached its highest point of 350 million barrels in August, and then fell to 310 million barrels by December. Germany’s oil consumption was the lowest among the four countries, starting at 200 million barrels in January, peaking at 230 million barrels in August, and then decreasing to 200 million barrels by December.
In summary, while the USA and China showed a general increase in oil consumption over the year, India’s and Germany’s consumption fluctuated more, peaking in mid-year before declining towards the end.