IELTS Writing Task 1 Line Graph: Biểu đồ đường minh họa tỷ lệ tốt nghiệp đại học tại bốn quốc gia A, B, C và D trong giai đoạn từ năm 2013 đến năm 2023. Dữ liệu cho thấy sự biến động về tỷ lệ tốt nghiệp ở mỗi quốc gia, với xu hướng tăng hoặc giảm khác nhau qua các năm.
Bạn có thể đọc lại bài nói về Task 1 tại đây: IELTS Writing Task 1 cần lưu ý những gì?
Bạn cũng có thể đọc thêm bài viết này vì đề bài này là IELTS Writing Task 1 biểu đồ Line Graph.
IELTS Writing Task 1 Line Graph: University Graduation
You should spent about 20 mintutes on this task
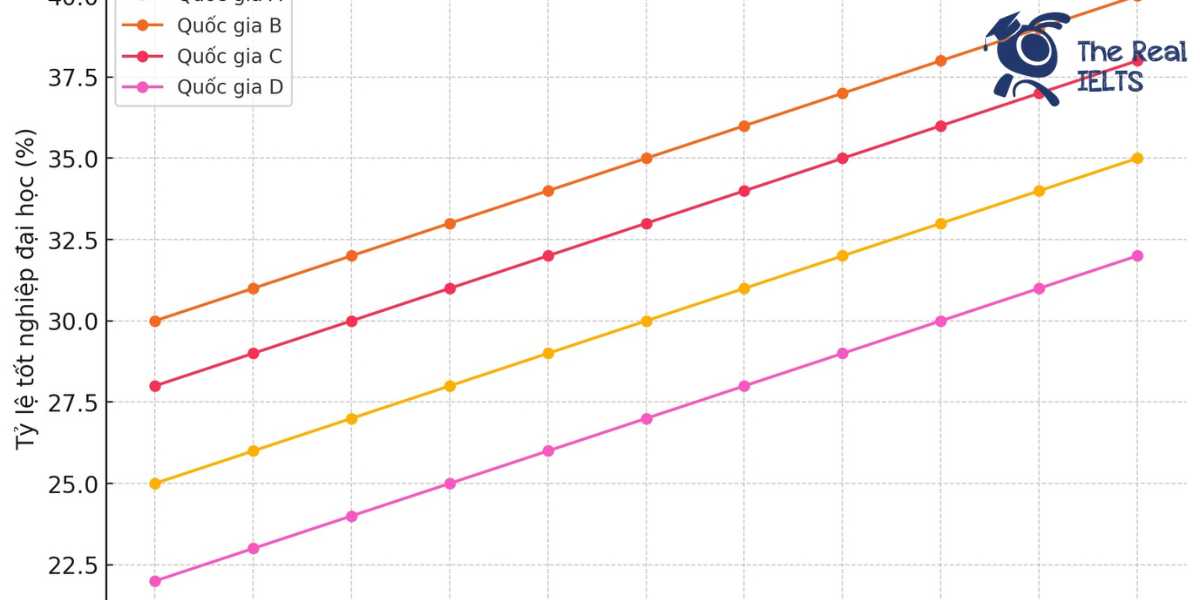
The line graph illustrates the university graduation rates in four countries A, B, C, and D from 2013 to 2023. The data shows fluctuations in graduation rates in each country, with different trends of increase or decrease over the years.
You should write at least 150 words.
Bảng thống kê tỷ lệ tốt nghiệp đại học hàng năm của bốn quốc gia từ năm 2013 đến năm 2023. Do không có số liệu cụ thể, số liệu dưới đây là giả định để đại diện.
| Năm | Quốc gia A | Quốc gia B | Quốc gia C | Quốc gia D |
|---|---|---|---|---|
| 2013 | 25% | 30% | 28% | 22% |
| 2014 | 26% | 31% | 29% | 23% |
| 2015 | 27% | 32% | 30% | 24% |
| 2016 | 28% | 33% | 31% | 25% |
| 2017 | 29% | 34% | 32% | 26% |
| 2018 | 30% | 35% | 33% | 27% |
| 2019 | 31% | 36% | 34% | 28% |
| 2020 | 32% | 37% | 35% | 29% |
| 2021 | 33% | 38% | 36% | 30% |
| 2022 | 34% | 39% | 37% | 31% |
| 2023 | 35% | 40% | 38% | 32% |

Bài tham khảo 1
The line graph illustrates the annual university graduation rates in four countries—Country A, Country B, Country C, and Country D—from 2013 to 2023.
Overall, all four countries show a steady increase in graduation rates over the ten-year period. Country B consistently has the highest graduation rates, while Country D remains the lowest throughout the period.
In 2013, Country B started with the highest graduation rate at 30%, followed by Country C at 28%, Country A at 25%, and Country D at 22%. Over the next decade, all four countries experienced a gradual rise in their graduation rates. By 2018, Country B reached 35%, while Country C and Country A followed with 33% and 30%, respectively. Country D remained the lowest at 27%.
Between 2019 and 2023, the upward trend continued. By 2023, Country B peaked at 40%, maintaining its lead. Country C and Country A also showed significant growth, reaching 38% and 35%, respectively. Country D, despite having the lowest rates, saw a consistent increase, culminating at 32% in 2023.
In summary, the data shows a consistent upward trajectory in university graduation rates across all four countries, with Country B maintaining the highest rates throughout the period, and Country D showing the lowest but steady growth.
Bài tham khảo 2
Introduction
The line graph illustrates the annual graduation rates from universities in four countries (A, B, C, and D) over a period of ten years, from 2013 to 2023.
Overview
Overall, all four countries experienced a steady increase in university graduation rates throughout the decade. Country B consistently had the highest graduation rate each year, while Country D had the lowest. Despite the disparities, the trends for all countries were upward.
Body 1
In 2013, Country B had the highest graduation rate at 30%, followed by Country C at 28%, Country A at 25%, and Country D at 22%. Over the next five years, the graduation rates for all countries rose steadily. By 2018, Country B’s graduation rate had increased to 35%, maintaining its lead. Country C and Country A saw their rates climb to 33% and 30%, respectively. Country D, while still having the lowest rate, improved to 27%.
Body 2
From 2019 to 2023, the upward trends continued. By 2023, Country B reached a peak of 40%, remaining the leader. Country C and Country A also showed significant improvements, with rates of 38% and 35%, respectively. Country D, although it continued to have the lowest rate among the four, reached a graduation rate of 32%. This consistent growth across all countries highlights the overall positive trend in higher education graduation rates over the decade.
Bài tham khảo 3
The line graph illustrates the annual graduation rates from universities in four countries, labeled as Country A, Country B, Country C, and Country D, over a decade from 2013 to 2023.
Overall, all four countries experienced a consistent increase in university graduation rates throughout the period. Notably, Country B maintained the highest graduation rate each year, while Country D had the lowest. However, the gap between the countries gradually narrowed over the years.
In 2013, Country B had the highest graduation rate at 30%, followed by Country C at 28%, Country A at 25%, and Country D at 22%. Over the next five years, all four countries saw a steady rise in their rates. By 2018, the graduation rates were 30% for Country A, 35% for Country B, 33% for Country C, and 27% for Country D.
The trend of increasing graduation rates continued in the second half of the period. By 2023, Country B’s graduation rate had risen to 40%, still leading among the four countries. Country A and Country C followed similar upward trajectories, reaching 35% and 38%, respectively. Country D, despite starting with the lowest rate, also saw significant improvement, ending at 32%.
In summary, while Country B consistently had the highest university graduation rates from 2013 to 2023, all four countries showed notable progress over the decade, with the differences in their rates becoming less pronounced over time.