Biểu đồ đường trong bài thi IELTS Writing Task 1 thể hiện sự tan chảy của băng qua các năm. Nó cho thấy xu hướng thay đổi lượng băng tan chảy theo thời gian, từ đó giúp người đọc nhận thấy tác động của biến đổi khí hậu. Người viết cần mô tả các xu hướng chính, so sánh số liệu và rút ra kết luận.
Bạn có thể đọc lại bài nói về Task 1 tại đây: IELTS Writing Task 1 cần lưu ý những gì?
Bạn cũng có thể đọc thêm bài viết này vì đề bài này là IELTS Writing Task 1 biểu đồ Line Graph.
IELTS Writing Task 1 Line Graph: ice melting
You should spent about 20 minutes on this task
The line graph in IELTS Writing Task 1 illustrates the melting of ice over the years. It shows the trend of changes in the amount of ice melting over time, helping readers recognize the impact of climate change. The writer needs to describe the main trends, compare the data, and draw conclusions.
You should write at least 150 words.

Bài Writing tham khảo 1
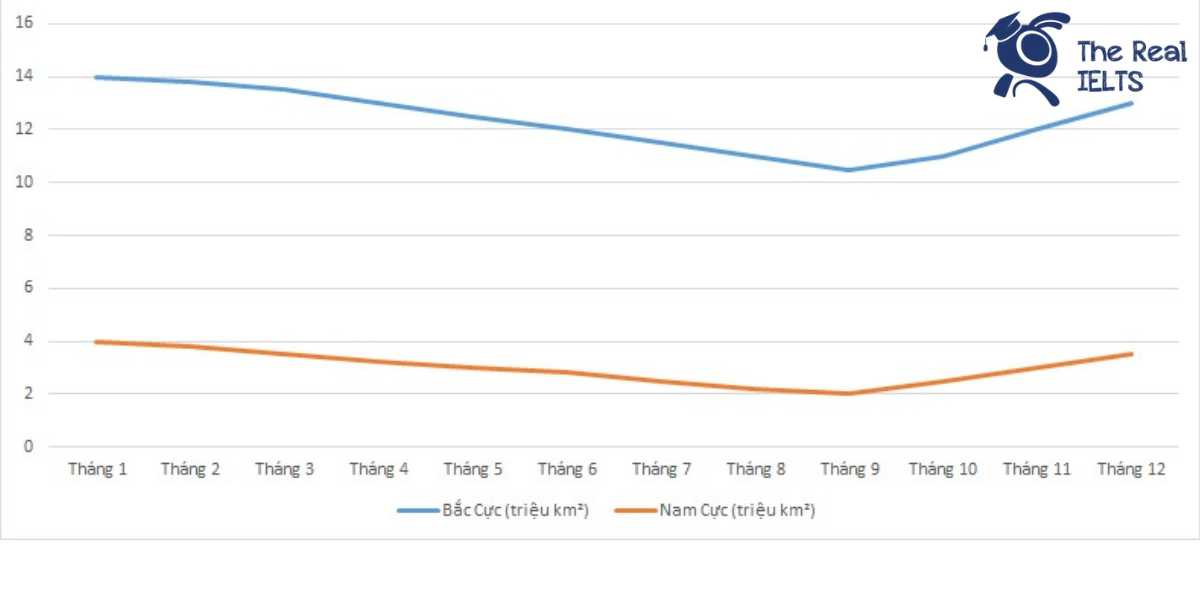
The line graph illustrates the monthly variation in sea ice extent in the Arctic and Antarctic regions over the course of a year, measured in million square kilometers.
Overall, the sea ice extent in the Arctic shows a steady decline from January to September, followed by a gradual increase from October to December. In contrast, the Antarctic sea ice extent follows an opposite pattern, decreasing from January to February, then steadily rising from March to November before slightly decreasing again in December.
In the Arctic, the sea ice extent starts at 14.0 million km² in January, dropping to its lowest point of 10.5 million km² in September. From this point, it begins to recover, reaching 13.0 million km² by December. This pattern indicates a significant seasonal fluctuation, with the maximum ice extent occurring during the winter months and the minimum during late summer.
Conversely, the Antarctic sea ice extent is lowest in February at 3.8 million km² and decreases further to 2.0 million km² by September. However, from October onwards, the ice extent increases again, peaking at 4.0 million km² in January. This seasonal cycle suggests that the Antarctic experiences its maximum ice extent during the winter months of the Southern Hemisphere, with a notable reduction during the summer.
In conclusion, while both the Arctic and Antarctic regions exhibit distinct seasonal patterns in sea ice extent, the Arctic experiences its minimum ice coverage in September, whereas the Antarctic reaches its minimum in February, highlighting the contrasting seasonal impacts on these polar regions.
Bài Writing tham khảo 2
The line graph illustrates the monthly variation in sea ice extent in the Arctic and Antarctic regions over a year, measured in million square kilometers.
Overall, the Arctic sea ice extent follows a decreasing trend from January to September and then increases until December. Conversely, the Antarctic sea ice extent increases from January to September and decreases towards December. The extent of sea ice in the Arctic is significantly higher than in the Antarctic throughout the year.
In the Arctic, the sea ice extent starts at 14.0 million km² in January and gradually decreases each month, reaching its lowest point of 10.5 million km² in September. From October, the sea ice extent begins to rise again, returning to 13.0 million km² by December.
The Antarctic sea ice extent shows a different pattern. Beginning at 4.0 million km² in January, it decreases to 2.0 million km² by September. However, from October onwards, the sea ice extent begins to increase, reaching 3.5 million km² in December.
In conclusion, while the Arctic experiences a consistent decrease and subsequent increase in sea ice extent, the Antarctic shows an opposite seasonal trend with a minimum in September and an increase towards the end of the year. This indicates a clear seasonal pattern in both polar regions.
Bài Writing tham khảo 3
The line graph illustrates the changes in the ice coverage in the Arctic and Antarctic regions over the span of a year, measured in million square kilometers.
Overview:
Overall, the ice coverage in the Arctic shows a clear downward trend from January to September, followed by an upward trend towards December. In contrast, the Antarctic ice coverage displays a more gradual fluctuation, decreasing until February, remaining relatively stable through September, and then increasing again towards the end of the year.
Body 1:
In the Arctic, the ice coverage starts at 14.0 million km² in January and gradually decreases each month, reaching its lowest point of 10.5 million km² in September. From this point, the ice coverage begins to increase, returning to 13.0 million km² by December. This pattern indicates a significant reduction in ice coverage during the warmer months and a recovery as temperatures drop.
Body 2:
Conversely, the Antarctic region experiences a different pattern. Starting at 4.0 million km² in January, the ice coverage reduces to 3.8 million km² in February and continues to shrink, hitting the lowest value of 2.0 million km² in September. Unlike the Arctic, the Antarctic ice coverage remains relatively stable from April to September, fluctuating slightly around the 2.0 to 3.2 million km² mark, before increasing again to 3.5 million km² by December.
In conclusion, while both regions show seasonal variations in ice coverage, the Arctic exhibits a more pronounced seasonal melt and refreeze cycle compared to the Antarctic, which shows a more gradual and less dramatic fluctuation throughout the year.