IELTS Writing Task 1 yêu cầu thí sinh mô tả biểu đồ thể hiện lượng nhập khẩu hàng tháng trong năm 2021 của bốn quốc gia. Bài viết cần nêu rõ xu hướng chính, so sánh số liệu giữa các quốc gia và tháng khác nhau, đồng thời sử dụng từ vựng và ngữ pháp phù hợp để mô tả dữ liệu một cách chính xác và mạch lạc.
Bạn có thể đọc lại bài nói về Task 1 tại đây: IELTS Writing Task 1 cần lưu ý những gì?
Bạn cũng có thể đọc thêm bài viết này vì đề bài này là IELTS Writing Task 1 biểu đồ Line Graph.
Bạn cũng có thể Xây Dựng Lộ Trình Cá Nhân Hóa của mình tại link.
IELTS Writing Task 1 Line Graph: Import Volumes
You should spent about 20 mintutes on this task
IELTS Writing Task 1 requires candidates to describe a chart showing the monthly import volumes of four countries in 2021. The essay needs to highlight the main trends, compare the figures between different countries and months, and use appropriate vocabulary and grammar to describe the data accurately and coherently.
You should write at least 150 words.
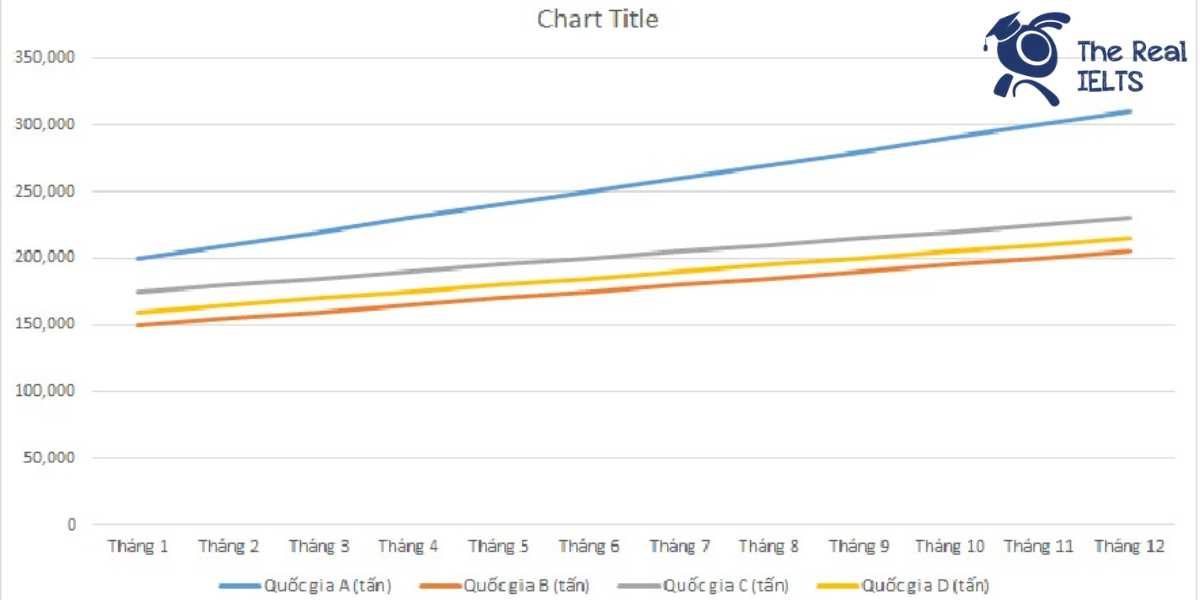
| Tháng | Quốc gia A (tấn) | Quốc gia B (tấn) | Quốc gia C (tấn) | Quốc gia D (tấn) |
| Tháng 1 | 200,000 | 150,000 | 175,000 | 160,000 |
| Tháng 2 | 210,000 | 155,000 | 180,000 | 165,000 |
| Tháng 3 | 220,000 | 160,000 | 185,000 | 170,000 |
| Tháng 4 | 230,000 | 165,000 | 190,000 | 175,000 |
| Tháng 5 | 240,000 | 170,000 | 195,000 | 180,000 |
| Tháng 6 | 250,000 | 175,000 | 200,000 | 185,000 |
| Tháng 7 | 260,000 | 180,000 | 205,000 | 190,000 |
| Tháng 8 | 270,000 | 185,000 | 210,000 | 195,000 |
| Tháng 9 | 280,000 | 190,000 | 215,000 | 200,000 |
| Tháng 10 | 290,000 | 195,000 | 220,000 | 205,000 |
| Tháng 11 | 300,000 | 200,000 | 225,000 | 210,000 |
| Tháng 12 | 310,000 | 205,000 | 230,000 | 215,000 |

Bài tham khảo 1
The table below provides data on the monthly import volumes of four countries in 2021. The figures, presented in tons, show the import trends for Country A, Country B, Country C, and Country D over the span of twelve months.
Overview: The import volumes of all four countries exhibit an upward trend throughout the year. Country A consistently has the highest import figures, while Country B has the lowest. There is a steady increase in imports across all countries each month, reflecting growing import activities.
Body 1: Country A starts the year with an import volume of 200,000 tons in January, which progressively increases by 10,000 tons each month, reaching a peak of 310,000 tons in December. Similarly, Country B, which has the lowest import volume, begins with 150,000 tons in January and sees a consistent monthly increase of 5,000 tons, culminating in 205,000 tons by the end of the year.
Body 2: Country C and Country D also show notable growth in their import volumes. Country C imports 175,000 tons in January and increases by 5,000 tons each month, ending the year at 230,000 tons. Country D’s imports follow a similar pattern, starting at 160,000 tons in January and increasing by 5,000 tons monthly, reaching 215,000 tons in December. Both countries maintain a steady rise in their import figures, reflecting a stable growth trajectory.
In summary, the data illustrates a consistent and steady increase in monthly imports for all four countries throughout 2021, with Country A leading in import volumes and Country B maintaining the lowest figures.
Bài tham khảo 2
Introduction
The table illustrates the monthly import volumes of four countries (A, B, C, and D) in 2021, with quantities measured in tons.
Overview
Overall, all four countries show a steady increase in import volumes throughout the year. Country A consistently has the highest imports each month, while Country B has the lowest. The difference in import volumes among the countries gradually widens as the year progresses.
Body 1
At the beginning of the year, Country A imported 200,000 tons in January, followed by a steady monthly increase, reaching 310,000 tons in December. Similarly, Country B started with 150,000 tons in January and saw a gradual rise to 205,000 tons by the end of the year. Country C began the year importing 175,000 tons and incrementally increased to 230,000 tons in December.
Body 2
Country D’s import volumes also displayed a consistent upward trend, starting from 160,000 tons in January and ending at 215,000 tons in December. The monthly increments for all countries were relatively uniform, with each country showing an approximate increase of 10,000 tons per month. This trend highlights the growing demand for imports across all four countries throughout 2021.
Bài tham khảo 3
Introduction
The table provides statistical data on the monthly import volumes of four countries (A, B, C, and D) throughout the year 2021. The figures are presented in metric tons.
Overview
Overall, there was a consistent increase in the import volumes for all four countries over the twelve-month period. Country A had the highest import volumes each month, while Country B had the lowest. All countries exhibited a similar upward trend in their import quantities.
Body 1
In January, Country A imported 200,000 tons, which was the highest among the four countries. This figure gradually increased by 10,000 tons each month, reaching 310,000 tons in December. Country B started with the lowest import volume of 150,000 tons in January and experienced a monthly increase of 5,000 tons, culminating in 205,000 tons in December.
Body 2
Country C’s import volumes also followed an upward trend, starting at 175,000 tons in January and ending at 230,000 tons in December. Similarly, Country D’s imports began at 160,000 tons in January and increased steadily to 215,000 tons by December. Despite the variations in initial import volumes, all four countries demonstrated consistent growth in their import activities throughout the year.
Bài tham khảo 4
Introduction
The table illustrates the monthly import volumes (in tons) of four countries (A, B, C, and D) throughout the year 2021.
Overview
Overall, all four countries showed a consistent increase in import volumes over the twelve months. Country A had the highest import volumes every month, while Country B had the lowest. The differences between the countries’ import volumes gradually widened as the year progressed.
Body 1
In January, Country A imported 200,000 tons, which was the highest among the four countries. This was followed by Country C with 175,000 tons, Country D with 160,000 tons, and Country B with 150,000 tons. As the months passed, all countries saw a steady increase in their import volumes. By June, Country A’s imports reached 250,000 tons, Country B’s imports were 175,000 tons, Country C’s imports rose to 200,000 tons, and Country D’s imports stood at 185,000 tons.
Body 2
In the latter half of the year, the trend of rising imports continued. By December, Country A’s imports had surged to 310,000 tons, marking the largest volume for the year. Country C followed with 230,000 tons, while Country D and Country B had imports of 215,000 tons and 205,000 tons, respectively. The increasing trend was consistent across all months, indicating robust and growing demand for imports in each country.
Bài tham khảo 5
Introduction
The table illustrates the monthly import volumes (in tons) of four countries (A, B, C, and D) throughout the year 2021.
Overview
Overall, all four countries experienced a consistent increase in their import volumes from January to December. Among these countries, Country A had the highest import volumes, while Country B had the lowest across the entire year.
Body 1
At the beginning of the year, in January, Country A imported 200,000 tons, which was significantly higher compared to Country B’s 150,000 tons, Country C’s 175,000 tons, and Country D’s 160,000 tons. This trend continued consistently with Country A leading in imports. By June, Country A’s imports had risen to 250,000 tons, with Countries B, C, and D importing 175,000, 200,000, and 185,000 tons respectively.
Body 2
In the latter half of the year, the import volumes continued to grow steadily for all countries. By December, Country A reached its peak at 310,000 tons. Country B, while having the lowest imports overall, increased its volume to 205,000 tons. Meanwhile, Country C and Country D also saw significant increases, reaching 230,000 and 215,000 tons respectively. This consistent upward trend highlights a strong demand and possibly a growing economy across these nations.