IELTS Writing Task 1 yêu cầu thí sinh mô tả biểu đồ về tỷ lệ lạm phát hàng tháng trong năm 2012 của bốn quốc gia. Thí sinh cần phân tích và so sánh sự biến động lạm phát giữa các quốc gia, nêu rõ xu hướng và điểm nổi bật. Yêu cầu sử dụng ngôn ngữ học thuật và cấu trúc rõ ràng.
Bạn có thể đọc lại bài nói về Task 1 tại đây: IELTS Writing Task 1 cần lưu ý những gì?
Bạn cũng có thể đọc thêm bài viết này vì đề bài này là IELTS Writing Task 1 biểu đồ Line Graph.
IELTS Writing Task 1 Line Graph: Inflation Rates
You should spent about 20 mintutes on this task
IELTS Writing Task 1 requires candidates to describe a chart showing the monthly inflation rates in 2012 for four countries. Candidates need to analyze and compare the fluctuations in inflation between the countries, highlighting trends and notable points. It is essential to use academic language and clear structure.
You should write at least 150 words.
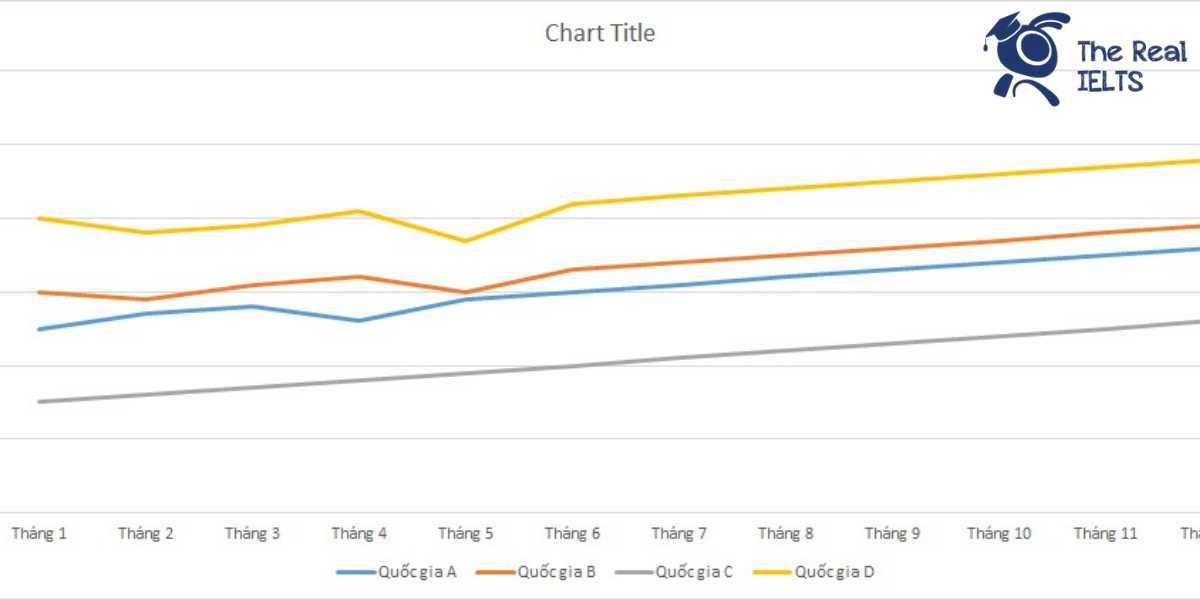
| Tháng | Quốc gia A | Quốc gia B | Quốc gia C | Quốc gia D |
| Tháng 1 | 2.5% | 3.0% | 1.5% | 4.0% |
| Tháng 2 | 2.7% | 2.9% | 1.6% | 3.8% |
| Tháng 3 | 2.8% | 3.1% | 1.7% | 3.9% |
| Tháng 4 | 2.6% | 3.2% | 1.8% | 4.1% |
| Tháng 5 | 2.9% | 3.0% | 1.9% | 3.7% |
| Tháng 6 | 3.0% | 3.3% | 2.0% | 4.2% |
| Tháng 7 | 3.1% | 3.4% | 2.1% | 4.3% |
| Tháng 8 | 3.2% | 3.5% | 2.2% | 4.4% |
| Tháng 9 | 3.3% | 3.6% | 2.3% | 4.5% |
| Tháng 10 | 3.4% | 3.7% | 2.4% | 4.6% |
| Tháng 11 | 3.5% | 3.8% | 2.5% | 4.7% |
| Tháng 12 | 3.6% | 3.9% | 2.6% | 4.8% |

Bài tham khảo 1
The line graph illustrates the monthly inflation rates in 2012 for four countries: Country A, Country B, Country C, and Country D. The data is provided on a monthly basis, showing the fluctuation in inflation rates over the year.
Overall, all four countries experienced a general upward trend in their inflation rates throughout the year. Country D consistently had the highest inflation rates, while Country C had the lowest. The inflation rates in Country A and Country B showed similar patterns, although Country B started with a slightly higher rate.
In the first half of the year, from January to June, Country D had the highest inflation rate, starting at 4.0% and rising to 4.2%. Country A started at 2.5% and gradually increased to 3.0% by June. Meanwhile, Country B’s inflation rate fluctuated slightly but remained around 3.0%, and Country C showed a steady increase from 1.5% to 2.0%.
In the second half of the year, from July to December, all countries continued to see an increase in their inflation rates. Country D’s inflation rate peaked at 4.8% in December. Country A’s inflation rate rose to 3.6%, while Country B reached 3.9%. Country C’s inflation rate, although the lowest among the four, also showed an upward trend, ending the year at 2.6%.
In summary, the data reveals that all four countries experienced rising inflation rates in 2012, with Country D consistently having the highest rates and Country C the lowest. The patterns suggest a general increase in inflationary pressures across these nations throughout the year.
Bài tham khảo 2
The line graph illustrates the monthly inflation rates of four countries—Country A, Country B, Country C, and Country D—throughout the year 2012.
Overall, all four countries experienced an upward trend in inflation rates over the course of the year. Country D consistently had the highest inflation rate, while Country C had the lowest. Countries A and B had moderate inflation rates that increased steadily.
In January, Country D had the highest inflation rate at 4.0%, followed by Country B at 3.0%, Country A at 2.5%, and Country C at 1.5%. Over the first half of the year, Country D’s inflation rate fluctuated slightly, decreasing to 3.7% in May before rising again to 4.2% in June. Meanwhile, the inflation rates of Country A and Country B increased steadily, reaching 3.0% and 3.3%, respectively, in June. Country C saw a gradual increase from 1.5% to 2.0% during the same period.
From July to December, Country D continued to have the highest inflation rates, climbing to 4.8% by the end of the year. Country A’s inflation rate rose steadily each month, reaching 3.6% in December. Similarly, Country B’s inflation rate increased to 3.9% in December. Country C maintained the lowest inflation rates throughout the year but saw a consistent rise, ending the year at 2.6%.
In conclusion, all four countries experienced rising inflation rates throughout 2012, with Country D having the highest rates and Country C the lowest. The overall trend for each country was an upward trajectory in inflation.
Bài tham khảo 3
Introduction:
The line graph illustrates the monthly inflation rates of four countries, namely Country A, Country B, Country C, and Country D, throughout the year 2012. The data is presented as percentages and compares the inflation trends of each nation from January to December.
Overview:
Overall, all four countries experienced an upward trend in their inflation rates over the year. Country D consistently had the highest inflation rate, while Country C had the lowest. Country A and Country B displayed moderate inflation rates, with Country B generally higher than Country A.
Body 1:
In the first half of the year, Country D showed the highest inflation rates, starting at 4.0% in January and slightly fluctuating but maintaining the highest position among the four countries. By June, Country D’s inflation rate had reached 4.2%. Country A began the year with a 2.5% inflation rate, which gradually increased to 3.0% by June. Meanwhile, Country B started at 3.0% in January and had a slight dip to 2.9% in February but then rose steadily to 3.3% by June. Country C had the lowest initial rate at 1.5% and experienced a steady increase to 2.0% in June.
Body 2:
In the second half of the year, all countries continued to experience rising inflation rates. Country D’s inflation rate climbed from 4.2% in June to 4.8% in December, maintaining its position as the country with the highest inflation. Country A saw a steady rise from 3.0% in June to 3.6% in December. Country B’s inflation rate increased from 3.3% in June to 3.9% by the end of the year. Country C also saw a consistent increase, from 2.0% in June to 2.6% in December. Throughout the year, Country D maintained the highest inflation rates, while Country C had the lowest, with the other two countries falling in between.