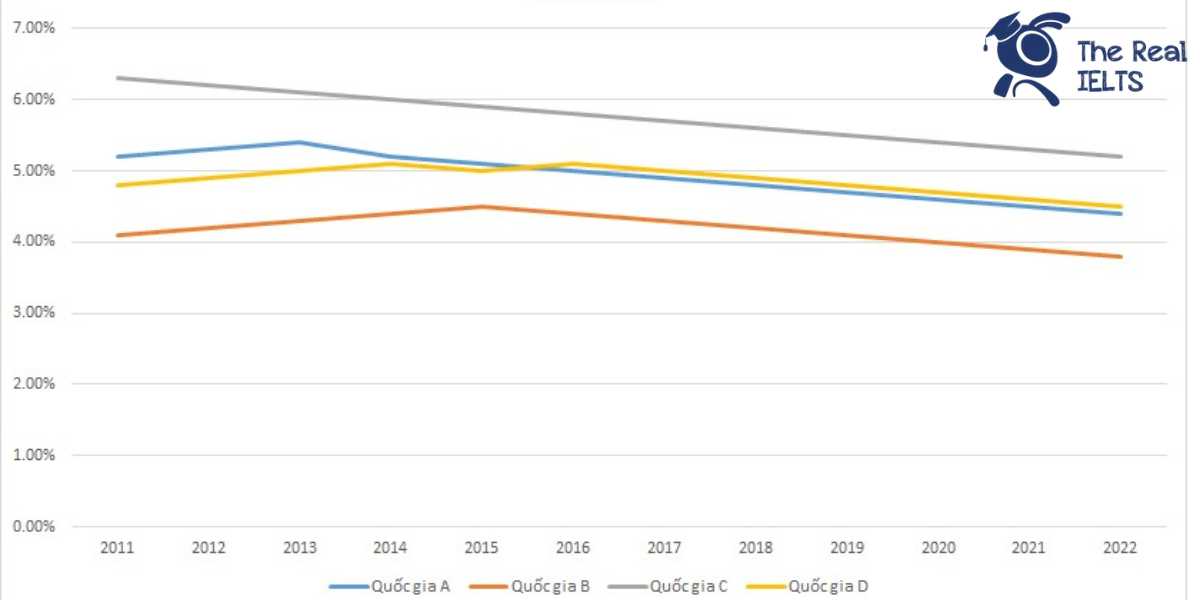
IELTS Writing Task 1 yêu cầu mô tả và phân tích biểu đồ tỷ lệ kết hôn hàng năm từ năm 2011 đến năm 2022 của 4 quốc gia. Người viết cần so sánh sự thay đổi tỷ lệ kết hôn qua các năm, nêu ra những điểm nổi bật và xu hướng chung, cũng như sự khác biệt giữa các quốc gia này.
Bạn có thể đọc lại bài nói về Task 1 tại đây: IELTS Writing Task 1 cần lưu ý những gì?
Bạn cũng có thể đọc thêm bài viết này vì đề bài này là IELTS Writing Task 1 biểu đồ Line Graph.
Bạn cũng có thể Xây Dựng Lộ Trình Cá Nhân Hóa của mình tại link.
IELTS Writing Task 1 Line Graph: Marriage Rates
You should spent about 20 mintutes on this task
IELTS Writing Task 1 requires describing and analyzing the chart of annual marriage rates from 2011 to 2022 in four countries. The writer needs to compare the changes in marriage rates over the years, highlight significant points and general trends, as well as the differences between these countries.
You should write at least 150 words.
| Năm | Quốc gia A | Quốc gia B | Quốc gia C | Quốc gia D |
| 2011 | 5.20% | 4.10% | 6.30% | 4.80% |
| 2012 | 5.30% | 4.20% | 6.20% | 4.90% |
| 2013 | 5.40% | 4.30% | 6.10% | 5.00% |
| 2014 | 5.20% | 4.40% | 6.00% | 5.10% |
| 2015 | 5.10% | 4.50% | 5.90% | 5.00% |
| 2016 | 5.00% | 4.40% | 5.80% | 5.10% |
| 2017 | 4.90% | 4.30% | 5.70% | 5.00% |
| 2018 | 4.80% | 4.20% | 5.60% | 4.90% |
| 2019 | 4.70% | 4.10% | 5.50% | 4.80% |
| 2020 | 4.60% | 4.00% | 5.40% | 4.70% |
| 2021 | 4.50% | 3.90% | 5.30% | 4.60% |
| 2022 | 4.40% | 3.80% | 5.20% | 4.50% |

Bài tham khảo 1
The table illustrates the annual marriage rates from 2011 to 2022 in four countries: A, B, C, and D.
Overall, the marriage rates in all four countries show a general declining trend over the given period. Country C consistently had the highest marriage rates, while Country B had the lowest.
In 2011, Country A had a marriage rate of 5.2%, which gradually declined to 4.4% by 2022. Country B started at 4.1% in 2011 and experienced a similar downward trend, ending at 3.8% in 2022. The decline in marriage rates in both countries was steady but not drastic, indicating a gradual decrease in the number of marriages over the years.
Country C, which had the highest starting rate of 6.3% in 2011, saw a continuous decrease each year, ending at 5.2% in 2022. Despite this decline, Country C maintained the highest marriage rates throughout the period. In contrast, Country D began at 4.8% in 2011, peaked slightly at 5.1% in 2014 and 2016, then steadily decreased to 4.5% by 2022.
In conclusion, although all four countries exhibited a downward trend in marriage rates from 2011 to 2022, Country C consistently had the highest rates, while Country B had the lowest, with the gap between the highest and lowest rates narrowing over time.
Bài tham khảo 2
Introduction: The table illustrates the annual marriage rates from 2011 to 2022 in four countries: A, B, C, and D. The percentages represent the proportion of the population that got married each year.
Overview: Overall, there was a noticeable decline in the marriage rates in all four countries over the given period. Country C consistently had the highest marriage rates, while Country B had the lowest throughout the years.
Body 1: In 2011, Country A had a marriage rate of 5.2%, which gradually decreased to 4.4% by 2022. Country B started at 4.1% in 2011 and saw a steady decline to 3.8% in 2022. Despite minor fluctuations, both countries exhibited a consistent downward trend over the years.
Body 2: Country C began with the highest marriage rate of 6.3% in 2011, but this figure decreased each year, reaching 5.2% in 2022. Similarly, Country D started with a rate of 4.8% in 2011, which fluctuated slightly but also ultimately declined to 4.5% by 2022. Although the marriage rates varied, the overall trend for all countries was a gradual decrease over the twelve-year period.
Bài tham khảo 3
Introduction
The table provides data on the annual marriage rates from 2011 to 2022 in four countries: Country A, Country B, Country C, and Country D.
Overview
Overall, all four countries experienced a decline in marriage rates over the 12-year period. Country C consistently had the highest marriage rate, while Country B had the lowest.
Body 1
In 2011, Country C had the highest marriage rate at 6.3%, followed by Country A at 5.2%, Country D at 4.8%, and Country B at 4.1%. Over the next few years, Country C saw a gradual decrease, reaching 5.2% by 2022. Similarly, Country A’s marriage rate dropped from 5.2% in 2011 to 4.4% in 2022, showing a steady decline each year.
Body 2
Country B and Country D followed similar trends, though at different magnitudes. Country B’s marriage rate decreased from 4.1% in 2011 to 3.8% in 2022, experiencing a minor yearly decline. Country D, which had a marriage rate of 4.8% in 2011, saw a gradual decline, ending at 4.5% in 2022. Despite fluctuations, the overall trend for all countries was a reduction in the marriage rates over the given period.
Bài tham khảo 4
The table presents the annual marriage rates from 2011 to 2022 in four countries: Country A, Country B, Country C, and Country D.
Overall, the marriage rates in all four countries showed a downward trend over the period. Country C consistently had the highest marriage rates, while Country B had the lowest.
In 2011, Country A had a marriage rate of 5.2%, which slightly increased to 5.4% by 2013. However, from 2014 onwards, the rate steadily declined, reaching 4.4% by 2022. Country B’s marriage rate was the lowest among the four countries, starting at 4.1% in 2011 and decreasing to 3.8% in 2022. The rate for Country B showed minor fluctuations but maintained a generally downward trajectory.
Country C had the highest marriage rate in 2011 at 6.3%. Despite a gradual decline over the years, it remained the highest among the four countries, ending at 5.2% in 2022. Country D’s marriage rate showed slight fluctuations, starting at 4.8% in 2011, peaking at 5.1% in 2014 and 2016, before gradually decreasing to 4.5% by 2022.
In conclusion, while all four countries experienced a decrease in marriage rates over the twelve-year period, Country C consistently had the highest rates, and Country B the lowest.
Bài tham khảo 5
Introduction
The table illustrates the annual marriage rates in four countries (A, B, C, and D) from 2011 to 2022.
Overview
Overall, all four countries experienced a decline in their marriage rates over the twelve-year period. Country A consistently had a moderate marriage rate, whereas Country C had the highest rates, despite the general downward trend. Country B had the lowest marriage rates throughout the period.
Body 1
In 2011, Country A had a marriage rate of 5.2%, which gradually decreased to 4.4% by 2022. Similarly, Country B’s marriage rate started at 4.1% in 2011 and fell to 3.8% in 2022, showing a consistent decrease over the years. The marriage rates in Country A and Country B followed a steady downward trajectory, with slight fluctuations in between.
Body 2
Country C had the highest initial marriage rate of 6.3% in 2011. However, this rate steadily declined to 5.2% by 2022. Country D’s marriage rate started at 4.8% in 2011, peaked at 5.1% in 2014 and 2016, and then gradually dropped to 4.5% by 2022. Despite these fluctuations, Country D’s rates remained relatively stable compared to the other countries.
In summary, although all four countries saw a decline in marriage rates from 2011 to 2022, the extent and patterns of these declines varied, with Country C maintaining the highest rates overall.