IELTS Writing Task 1 yêu cầu thí sinh miêu tả biểu đồ về số lượng chuyến bay hàng tháng trong năm 2011 của 4 quốc gia. Thí sinh cần phân tích và so sánh các xu hướng chính, điểm nổi bật, và bất kỳ sự biến đổi đáng chú ý nào giữa các quốc gia, sử dụng ngôn ngữ mô tả chính xác và mạch lạc.
Bạn có thể đọc lại bài nói về Task 1 tại đây: IELTS Writing Task 1 cần lưu ý những gì?
Bạn cũng có thể đọc thêm bài viết này vì đề bài này là IELTS Writing Task 1 biểu đồ Line Graph.
Bạn cũng có thể Xây Dựng Lộ Trình Cá Nhân Hóa của mình tại link.
IELTS Writing Task 1 Line Graph: Monthly Flights
You should spent about 20 mintutes on this task
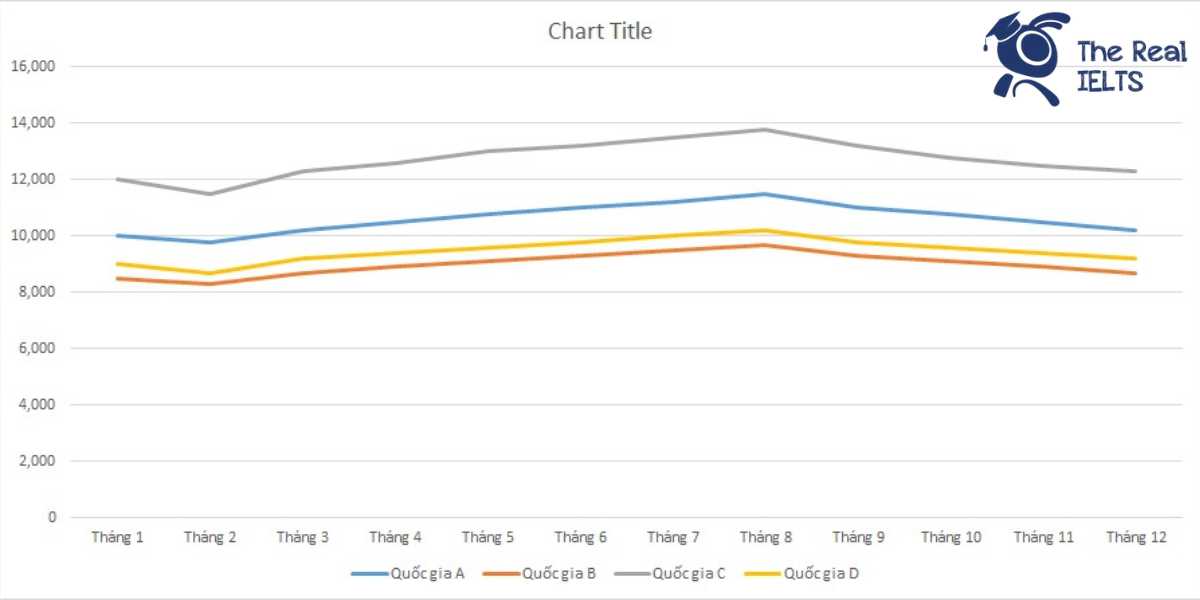
IELTS Writing Task 1 requires candidates to describe a chart showing the number of monthly flights in 2011 for four countries. Candidates need to analyze and compare the main trends, highlights, and any notable changes between the countries, using accurate and coherent descriptive language.
You should write at least 150 words.
| Tháng | Quốc gia A | Quốc gia B | Quốc gia C | Quốc gia D |
| Tháng 1 | 10,000 | 8,500 | 12,000 | 9,000 |
| Tháng 2 | 9,800 | 8,300 | 11,500 | 8,700 |
| Tháng 3 | 10,200 | 8,700 | 12,300 | 9,200 |
| Tháng 4 | 10,500 | 8,900 | 12,600 | 9,400 |
| Tháng 5 | 10,800 | 9,100 | 13,000 | 9,600 |
| Tháng 6 | 11,000 | 9,300 | 13,200 | 9,800 |
| Tháng 7 | 11,200 | 9,500 | 13,500 | 10,000 |
| Tháng 8 | 11,500 | 9,700 | 13,800 | 10,200 |
| Tháng 9 | 11,000 | 9,300 | 13,200 | 9,800 |
| Tháng 10 | 10,800 | 9,100 | 12,800 | 9,600 |
| Tháng 11 | 10,500 | 8,900 | 12,500 | 9,400 |
| Tháng 12 | 10,200 | 8,700 | 12,300 | 9,200 |

Bài tham khảo 1
Introduction
The table provides a detailed breakdown of the number of monthly flights in 2011 for four countries: Country A, Country B, Country C, and Country D.
Overview
Overall, Country C consistently had the highest number of flights each month, while Country B had the lowest. All four countries exhibited a general increase in flight numbers from January to August, followed by a slight decline towards the end of the year.
Body 1
In January, Country C led with 12,000 flights, followed by Country A with 10,000 flights, Country D with 9,000 flights, and Country B with 8,500 flights. This trend continued with incremental increases each month. By August, Country C reached a peak of 13,800 flights, while Country A, Country D, and Country B recorded 11,500, 10,200, and 9,700 flights respectively.
Body 2
After August, the number of flights began to decline. For instance, Country A’s flights decreased from 11,500 in August to 10,200 by December. Similarly, Country B dropped from 9,700 to 8,700, Country C from 13,800 to 12,300, and Country D from 10,200 to 9,200 in the same period. Despite these decreases, Country C maintained the highest number of flights throughout the year.
Bài tham khảo 2
The table illustrates the monthly number of flights in 2011 for four countries: Country A, Country B, Country C, and Country D.
Overall, Country C consistently had the highest number of flights throughout the year, while Country B had the lowest. The number of flights for all countries showed a general increase during the first eight months before slightly declining towards the end of the year.
In the first half of the year, Country C led with 12,000 flights in January, gradually increasing to 13,200 in June. Country A followed, starting at 10,000 flights in January and reaching 11,000 by June. Country D started with 9,000 flights in January and ended the first half with 9,800 flights. Country B had the lowest numbers, starting with 8,500 flights in January and increasing to 9,300 by June.
During the second half of the year, Country C maintained its lead, peaking at 13,800 flights in August before dropping back to 12,300 by December. Country A also saw a peak in August with 11,500 flights, followed by a slight decline to 10,200 in December. Similarly, Country D peaked at 10,200 flights in August and ended the year with 9,200 flights. Country B, despite having the lowest figures throughout the year, peaked at 9,700 flights in August and declined to 8,700 by December.
In summary, Country C had the highest number of flights each month, while Country B had the lowest. All countries experienced growth in the first eight months of the year, followed by a slight decrease towards the end of the year.
Bài tham khảo 3
The table provides data on the monthly number of flights in four countries (A, B, C, and D) during the year 2011.
Overview: Overall, Country C consistently had the highest number of flights each month, while Country B had the lowest. There was a general upward trend in the number of flights for all countries from January to August, followed by a slight decrease towards the end of the year.
Body 1: Country A started the year with 10,000 flights in January and saw a gradual increase, peaking at 11,500 flights in August. After August, the number of flights slightly decreased, ending the year with 10,200 flights in December. Similarly, Country B began with 8,500 flights in January and increased steadily, reaching a peak of 9,700 flights in August, before declining to 8,700 flights in December.
Body 2: Country C consistently had the highest number of flights each month, starting with 12,000 in January and reaching a peak of 13,800 flights in August. The number then slightly decreased, ending the year with 12,300 flights in December. Country D followed a similar trend, beginning with 9,000 flights in January, peaking at 10,200 in August, and concluding the year with 9,200 flights in December.
In conclusion, the data indicates a general increase in flight numbers during the middle of the year, especially in the summer months, with a slight decline towards the year’s end across all four countries.
Bài tham khảo 4
The table provides statistical data on the number of monthly flights in four countries (A, B, C, and D) throughout the year 2011.
Overview: Overall, Country C consistently had the highest number of flights each month, while Country B had the lowest. The flight numbers in all countries showed a gradual increase from January to August, followed by a slight decline towards the end of the year.
Body 1: Country A began the year with 10,000 flights in January and experienced a steady increase, reaching a peak of 11,500 flights in August. Following this, the numbers decreased slightly, ending the year with 10,200 flights in December. Similarly, Country B started with 8,500 flights in January, rising steadily to 9,700 flights in August, before dropping back to 8,700 flights by December.
Body 2: Country C consistently led the other countries with the highest flight numbers, starting at 12,000 in January and reaching 13,800 by August. Although there was a decline in the following months, it remained high at 12,300 in December. Country D also followed a similar pattern, starting with 9,000 flights in January, peaking at 10,200 in August, and then slightly decreasing to 9,200 by December.
In conclusion, all four countries exhibited a general upward trend in the number of flights from January to August, followed by a minor reduction towards the year’s end, with Country C maintaining the highest flight numbers throughout the year.