IELTS Writing Task 1 yêu cầu thí sinh phân tích biểu đồ lượng mưa hàng tháng của bốn thành phố trong năm 2021. Thí sinh cần so sánh và miêu tả sự thay đổi về lượng mưa theo thời gian, nêu rõ điểm khác biệt và xu hướng chung giữa các thành phố, sử dụng từ vựng và cấu trúc ngữ pháp phù hợp.
Bạn có thể đọc lại bài nói về Task 1 tại đây: IELTS Writing Task 1 cần lưu ý những gì?
Bạn cũng có thể đọc thêm bài viết này vì đề bài này là IELTS Writing Task 1 biểu đồ Line Graph.
IELTS Writing Task 1 Line Graph
You should spent about 20 mintutes on this task
IELTS Writing Task 1 requires candidates to analyze a chart of monthly rainfall for four cities in the year 2021. Candidates need to compare and describe the changes in rainfall over time, highlighting the differences and general trends between the cities, using appropriate vocabulary and grammatical structures.
You should write at least 150 words.
| Tháng | Hà Nội (mm) | TP. Hồ Chí Minh (mm) | Đà Nẵng (mm) | Cần Thơ (mm) |
| Tháng 1 | 20 | 10 | 40 | 15 |
| Tháng 2 | 25 | 5 | 45 | 10 |
| Tháng 3 | 30 | 15 | 50 | 20 |
| Tháng 4 | 40 | 40 | 60 | 30 |
| Tháng 5 | 100 | 200 | 120 | 150 |
| Tháng 6 | 150 | 250 | 180 | 200 |
| Tháng 7 | 200 | 300 | 220 | 250 |
| Tháng 8 | 250 | 350 | 260 | 300 |
| Tháng 9 | 300 | 400 | 300 | 350 |
| Tháng 10 | 200 | 250 | 180 | 200 |
| Tháng 11 | 100 | 150 | 120 | 100 |
| Tháng 12 | 50 | 100 | 80 | 60 |

Bài tham khảo 1
Introduction
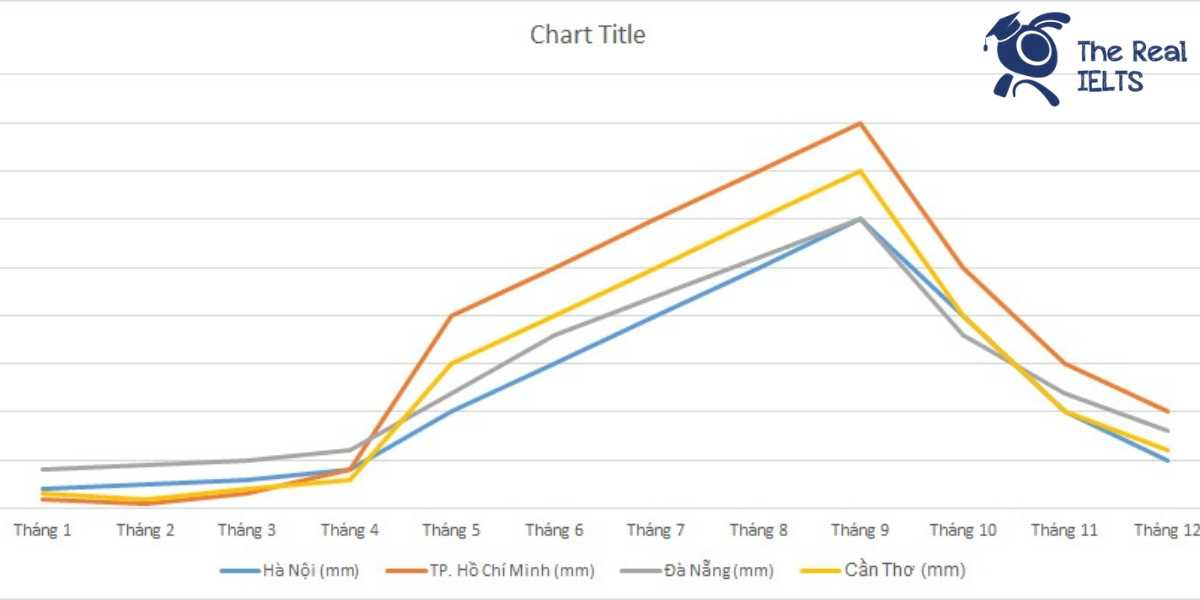
The line graph illustrates the monthly rainfall amounts in four cities in Vietnam (Hanoi, Ho Chi Minh City, Da Nang, and Can Tho) throughout the year 2021.
Overview
Overall, all four cities experienced an increase in rainfall from the beginning of the year, peaking around September, before declining towards the end of the year. Notably, Ho Chi Minh City consistently received the highest amount of rainfall compared to the other cities.
Body 1
In the early months of the year, January to April, the rainfall in all four cities was relatively low. Hanoi saw a gradual increase from 20 mm in January to 40 mm in April. Similarly, Da Nang and Can Tho experienced a steady rise, with Da Nang’s rainfall increasing from 40 mm to 60 mm and Can Tho’s from 15 mm to 30 mm. Ho Chi Minh City had a slightly different pattern, starting at 10 mm in January and reaching 40 mm by April.
Body 2
From May to September, rainfall levels surged dramatically in all cities. Ho Chi Minh City recorded the highest figures, escalating from 200 mm in May to 400 mm in September. Hanoi’s rainfall also climbed significantly, peaking at 300 mm in September. Da Nang and Can Tho followed a similar trend, with Da Nang reaching 300 mm and Can Tho hitting 350 mm in September.
In the last quarter of the year, the rainfall in all cities decreased, with Ho Chi Minh City and Hanoi witnessing a sharper decline compared to Da Nang and Can Tho. By December, the rainfall figures dropped to their lowest, with Hanoi at 50 mm, Ho Chi Minh City at 100 mm, Da Nang at 80 mm, and Can Tho at 60 mm.
Bài tham khảo 2
Introduction
The line graph illustrates the monthly rainfall in four Vietnamese cities—Hà Nội, TP. Hồ Chí Minh, Đà Nẵng, and Cần Thơ—throughout the year 2021.
Overview
Overall, all four cities experienced an increase in rainfall from the beginning to the middle of the year, with the highest levels occurring between July and September. Afterward, there was a noticeable decline towards the end of the year. TP. Hồ Chí Minh consistently received the highest rainfall, while Hà Nội and Đà Nẵng showed similar trends but with lower figures. Cần Thơ had moderate levels of rainfall throughout the year.
Body 1
In the first four months, all cities exhibited a gradual rise in rainfall. Hà Nội’s rainfall increased from 20 mm in January to 40 mm in April. TP. Hồ Chí Minh had a significant rise from 10 mm to 40 mm in the same period. Similarly, Đà Nẵng’s rainfall rose from 40 mm to 60 mm, and Cần Thơ experienced an increase from 15 mm to 30 mm.
From May to August, there was a sharp escalation in rainfall. In Hà Nội, it surged from 100 mm in May to 250 mm in August. TP. Hồ Chí Minh saw an even steeper rise, reaching 350 mm in August from 200 mm in May. Đà Nẵng and Cần Thơ followed this pattern, with Đà Nẵng increasing from 120 mm to 260 mm and Cần Thơ from 150 mm to 300 mm.
Body 2
From September onwards, the rainfall began to decrease. Hà Nội experienced a peak at 300 mm in September, followed by a drop to 200 mm in October and further down to 50 mm by December. TP. Hồ Chí Minh’s rainfall peaked at 400 mm in September and then fell to 250 mm in October, ending the year at 100 mm in December. Đà Nẵng and Cần Thơ also showed a similar trend; Đà Nẵng’s rainfall decreased from 300 mm in September to 80 mm in December, while Cần Thơ’s dropped from 350 mm to 60 mm in the same period.
This pattern indicates a clear monsoon influence, with the heaviest rainfall in mid-year and much drier conditions towards the end of the year.
Bài tham khảo 3
Introduction
The line graph illustrates the monthly rainfall data for the year 2021 in four cities in Vietnam: Hanoi, Ho Chi Minh City, Da Nang, and Can Tho.
Overview
Overall, all four cities experienced fluctuations in their monthly rainfall, with the highest rainfall generally occurring in the middle months of the year. Notably, Ho Chi Minh City and Can Tho received the highest rainfall in September, whereas Hanoi and Da Nang had their peak rainfall in August and September respectively.
Body 1
In the early months of the year, rainfall levels were relatively low across all cities. In January, Hanoi, Ho Chi Minh City, Da Nang, and Can Tho received 20mm, 10mm, 40mm, and 15mm of rainfall, respectively. As the months progressed towards May, rainfall started to increase significantly. By May, Ho Chi Minh City experienced a sharp rise to 200mm, Can Tho to 150mm, Da Nang to 120mm, and Hanoi to 100mm.
Body 2
The peak rainy season occurred between June and September. In September, Ho Chi Minh City received the highest amount of rainfall at 400mm, followed by Can Tho at 350mm, Da Nang at 300mm, and Hanoi at 300mm. After September, rainfall levels began to decrease steadily. By December, rainfall reduced considerably, with Hanoi recording 50mm, Ho Chi Minh City 100mm, Da Nang 80mm, and Can Tho 60mm.
Overall, the data shows a clear trend of increasing rainfall from the beginning of the year, peaking around late summer, and then decreasing towards the end of the year.