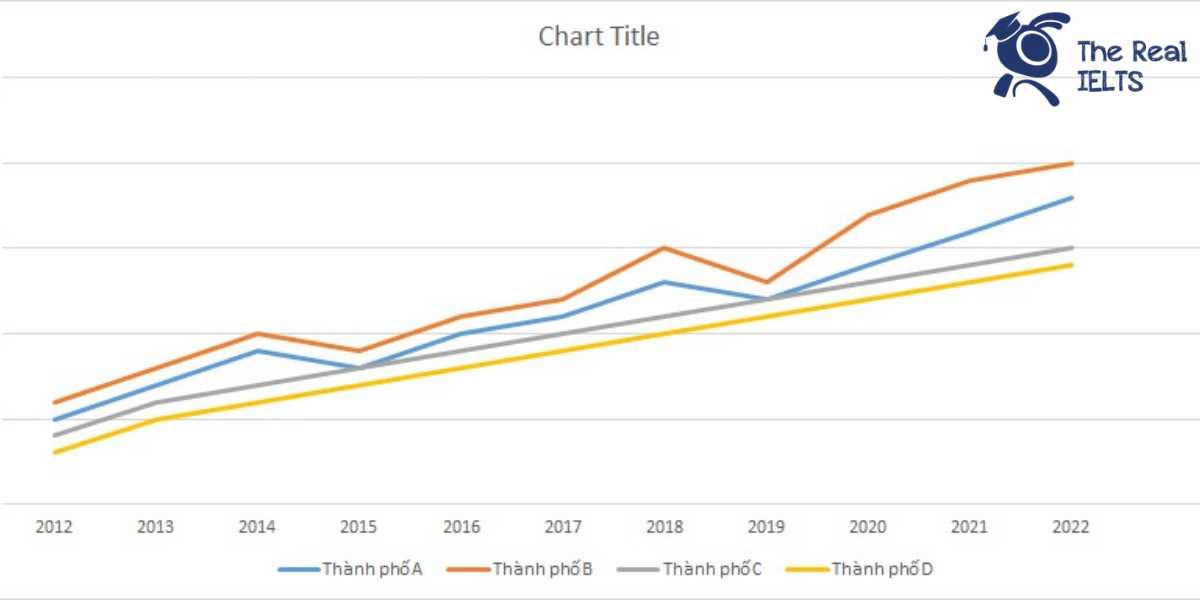
IELTS Writing Task 1 Line Graph: Đồ thị đường biểu diễn số lượng khách sạn mới khai trương hàng năm tại bốn thành phố từ năm 2012 đến năm 2022. Biểu đồ cung cấp cái nhìn chi tiết về xu hướng phát triển ngành du lịch qua số liệu khai trương khách sạn mới tại từng thành phố, giúp đánh giá mức độ tăng trưởng và cạnh tranh giữa các địa điểm.
Bạn có thể đọc lại bài nói về Task 1 tại đây: IELTS Writing Task 1 cần lưu ý những gì?
Bạn cũng có thể đọc thêm bài viết này vì đề bài này là IELTS Writing Task 1 biểu đồ Line Graph.
IELTS Writing Task 1 Line Graph: New Hotels
You should spent about 20 mintutes on this task
The line graph depicts the number of new hotels opened annually in four cities from 2012 to 2022. The chart provides a detailed insight into the tourism industry’s development trends through the data on new hotel openings in each city, helping to assess the growth rate and competition among the locations.
You should write at least 150 words.
| Năm | Thành phố A | Thành phố B | Thành phố C | Thành phố D |
| 2012 | 5 | 6 | 4 | 3 |
| 2013 | 7 | 8 | 6 | 5 |
| 2014 | 9 | 10 | 7 | 6 |
| 2015 | 8 | 9 | 8 | 7 |
| 2016 | 10 | 11 | 9 | 8 |
| 2017 | 11 | 12 | 10 | 9 |
| 2018 | 13 | 15 | 11 | 10 |
| 2019 | 12 | 13 | 12 | 11 |
| 2020 | 14 | 17 | 13 | 12 |
| 2021 | 16 | 19 | 14 | 13 |
| 2022 | 18 | 20 | 15 | 14 |

Bài tham khảo 1
The line graph illustrates the number of newly opened hotels each year from 2012 to 2022 in four cities: City A, City B, City C, and City D.
Overall, all four cities experienced an upward trend in the number of new hotel openings over the ten-year period. City B consistently led the count, while City D had the least number of new hotels each year. The gap between the cities widened, particularly in the latter half of the period.
In 2012, City B had the highest number of new hotels at six, followed by City A with five, City C with four, and City D with three. By 2017, City B and City A saw significant increases, reaching twelve and eleven new hotels respectively. City C and City D also grew, but at a slower pace, recording ten and nine new hotels each.
From 2018 to 2022, the growth accelerated, especially in City B and City A. By 2022, City B had the highest number of new hotel openings at twenty, followed by City A at eighteen. City C and City D continued to increase steadily, with City C reaching fifteen and City D fourteen new hotels. This marked a significant growth, particularly in City B, which had more than tripled its new hotel count from 2012.
In conclusion, all cities showed significant increases in the number of new hotel openings, with City B and City A experiencing the most substantial growth. City C and City D also grew steadily, but the rate of increase was more moderate compared to the other two cities.
Bài tham khảo 2
The line graph illustrates the number of new hotels opened annually in four cities from 2012 to 2022.
Overall, all four cities showed an upward trend in the number of new hotels over the period. Notably, City B consistently had the highest number of new hotels each year, while City D had the lowest, though the gap between the cities gradually narrowed over time.
In 2012, City B started with 6 new hotels, the highest among the four cities, followed by City A with 5, City C with 4, and City D with 3. By 2017, the number of new hotels increased in all cities, with City B reaching 12, City A at 11, City C at 10, and City D at 9. This period marked steady growth across all cities, with City B maintaining its lead.
From 2018 to 2022, the growth continued, with City B experiencing the most significant increase, peaking at 20 new hotels in 2022. Similarly, City A saw a substantial rise, ending at 18 new hotels, while City C and City D also experienced growth, reaching 15 and 14 new hotels, respectively, by 2022.
In summary, while all cities saw growth in the number of new hotels opened annually, City B consistently led in numbers throughout the period, with all cities showing a steady upward trajectory in hotel openings.
Bài tham khảo 3
The line graph illustrates the number of new hotels opened annually in four cities (A, B, C, and D) from 2012 to 2022.
Overall, all four cities experienced an upward trend in the number of new hotel openings over the given period, with City B and City D showing the most significant increases.
In 2012, City B started with the highest number of new hotels at 6, followed by City A with 5, City C with 4, and City D with 3. By 2015, the numbers had increased in all cities, with City B and City A leading at 10 and 9 respectively, while City C and City D trailed behind at 8 and 7.
The trend continued upward in the subsequent years. By 2018, City B had opened 15 new hotels, the highest among the four cities, whereas City A and City C had 13 and 11 respectively, and City D had 10. In 2020, the figures showed City B still leading with 17 new hotels, and the gap between the cities widened further.
By the end of the period in 2022, City B had reached a peak of 20 new hotels, maintaining its lead, while City A followed closely with 18. City C and City D also showed growth, with 15 and 14 new hotels respectively. The data clearly indicate that all cities experienced steady growth in new hotel openings, with City B and City D demonstrating the most significant upward trends.