IELTS Writing Task 1 yêu cầu phân tích biểu đồ về doanh thu quảng cáo trực tuyến hàng tháng của bốn công ty trong năm 2021. Bạn cần mô tả các xu hướng, so sánh sự khác biệt và tương quan giữa các công ty. Lưu ý sử dụng ngôn ngữ chính xác, dữ liệu cụ thể và cấu trúc bài viết rõ ràng.
Bạn có thể đọc lại bài nói về Task 1 tại đây: IELTS Writing Task 1 cần lưu ý những gì?
Bạn cũng có thể đọc thêm bài viết này vì đề bài này là IELTS Writing Task 1 biểu đồ Line Graph.
Bạn cũng có thể Xây Dựng Lộ Trình Cá Nhân Hóa của mình tại link.
IELTS Writing Task 1 Line Graph: Online Advertising
You should spent about 20 mintutes on this task
IELTS Writing Task 1 requires analyzing a chart about the monthly online advertising revenue of four companies in 2021. You need to describe the trends, compare the differences, and identify the correlations between the companies. Pay attention to using precise language, specific data, and a clear structure in your writing.
You should write at least 150 words.
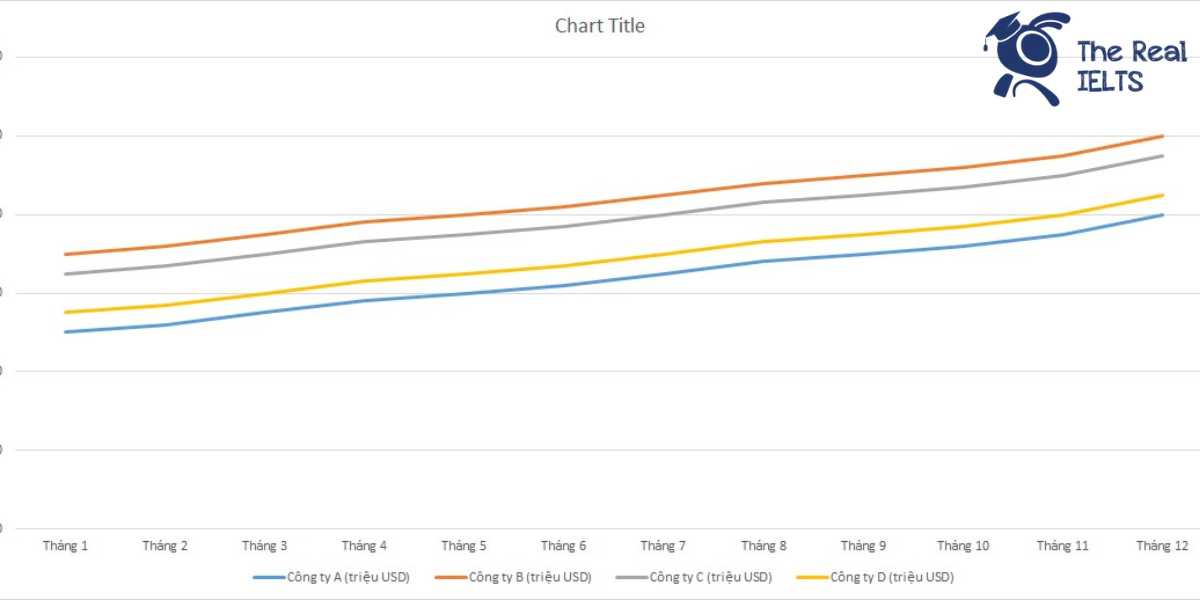
| Tháng | Công ty A (triệu USD) | Công ty B (triệu USD) | Công ty C (triệu USD) | Công ty D (triệu USD) |
| Tháng 1 | 50 | 70 | 65 | 55 |
| Tháng 2 | 52 | 72 | 67 | 57 |
| Tháng 3 | 55 | 75 | 70 | 60 |
| Tháng 4 | 58 | 78 | 73 | 63 |
| Tháng 5 | 60 | 80 | 75 | 65 |
| Tháng 6 | 62 | 82 | 77 | 67 |
| Tháng 7 | 65 | 85 | 80 | 70 |
| Tháng 8 | 68 | 88 | 83 | 73 |
| Tháng 9 | 70 | 90 | 85 | 75 |
| Tháng 10 | 72 | 92 | 87 | 77 |
| Tháng 11 | 75 | 95 | 90 | 80 |
| Tháng 12 | 80 | 100 | 95 | 85 |

Bài tham khảo 1
Introduction
The table presents the monthly revenue from online advertising for four companies (A, B, C, D) throughout the year 2021. The data is measured in millions of US dollars.
Overview
Overall, all four companies experienced a consistent increase in their online advertising revenues over the year. Company B generated the highest revenue each month, while Company A had the lowest monthly revenue among the four companies.
Body 1
In January, Company B led with $70 million, followed by Company C at $65 million, Company D at $55 million, and Company A at $50 million. As the year progressed, Company B’s revenue steadily increased, reaching $100 million in December. Similarly, Company C’s revenue grew from $65 million in January to $95 million in December, maintaining its position as the second highest earner.
Body 2
Company D, although initially starting with $55 million in January, showed a steady increase, ending the year at $85 million in December. Company A, which had the lowest revenue in January at $50 million, also experienced growth throughout the year, reaching $80 million by December. Despite being the lowest earner among the four, Company A showed a notable increase in its monthly online advertising revenue.
Conclusion
In summary, the data indicates that all four companies saw a progressive rise in their online advertising revenues over the year 2021, with Company B consistently leading and Company A remaining the lowest earner each month.
Bài tham khảo 2
Introduction
The table illustrates the monthly online advertising revenue for four companies (A, B, C, and D) throughout the year 2021, measured in millions of USD.
Overview
Overall, the data shows a consistent increase in advertising revenue for all four companies over the year. Company B consistently earned the highest revenue each month, while Company A had the lowest figures. Company C and Company D also saw significant growth in their advertising revenues.
Body 1
In January, Company B led with $70 million in revenue, followed by Company C with $65 million, Company D with $55 million, and Company A with $50 million. By June, all companies experienced an upward trend, with Company B reaching $82 million, Company C at $77 million, Company D at $67 million, and Company A at $62 million. This steady increase highlights the growing investment in online advertising.
Body 2
The second half of the year continued this growth pattern. By December, Company B’s revenue peaked at $100 million, followed by Company C at $95 million, Company D at $85 million, and Company A at $80 million. The monthly increments suggest strong market demand and effective advertising strategies across all four companies. Company A and D, despite being lower in revenue, also displayed significant growth, closing the gap with their competitors.
In conclusion, the table clearly demonstrates a substantial increase in online advertising revenue for all four companies, with Company B maintaining the highest earnings throughout the year.
Bài tham khảo 3
Introduction
The table presents the monthly online advertising revenues of four companies (A, B, C, and D) in 2021. The figures are provided in million USD, showcasing how each company’s earnings evolved over the year.
Overview
Overall, all four companies experienced a steady increase in their online advertising revenues throughout the year. Company B consistently earned the highest revenues each month, while Company A had the lowest. The revenue growth patterns for all companies show a similar upward trend.
Body 1
In January, Company B started with the highest revenue at 70 million USD, followed by Company C at 65 million USD, Company D at 55 million USD, and Company A at 50 million USD. Over the next few months, each company’s revenues increased steadily. By June, Company B’s revenue reached 82 million USD, Company C’s rose to 77 million USD, Company D’s increased to 67 million USD, and Company A’s grew to 62 million USD.
Body 2
The latter half of the year saw continued growth for all companies. In December, Company B achieved the highest revenue of the year at 100 million USD. Company C followed with 95 million USD, Company D with 85 million USD, and Company A with 80 million USD. This consistent growth pattern indicates a strong performance in online advertising across all four companies, with Company B maintaining its lead throughout the year.
Bài tham khảo 4
Introduction
The table illustrates the monthly online advertising revenue for four companies (A, B, C, and D) throughout the year 2021. The figures are presented in millions of USD.
Overview
Overall, all four companies experienced a steady increase in their online advertising revenue over the year. Company B consistently generated the highest revenue each month, followed by Companies C, D, and A.
Body 1
At the beginning of the year, Company B led the group with $70 million in January, while Companies C, D, and A recorded $65 million, $55 million, and $50 million, respectively. The upward trend continued for all companies, with Company B reaching $100 million by December, marking an increase of $30 million over the year. Similarly, Company C saw a rise from $65 million to $95 million, while Company D’s revenue grew from $55 million to $85 million.
Body 2
Company A, which had the lowest revenue initially, also showed significant growth, starting at $50 million in January and ending at $80 million in December. The monthly increments for all companies were relatively consistent, typically increasing by a few million dollars each month. By the end of the year, Company B maintained its leading position with the highest overall revenue, and Company A, despite being the lowest, demonstrated a commendable increase in its online advertising earnings.
Bài tham khảo 5
Introduction
The table illustrates the monthly online advertising revenue of four companies (A, B, C, and D) in 2021, expressed in million USD.
Overview
Overall, Company B consistently earned the highest revenue each month, while Company A had the lowest. All four companies showed an upward trend in their advertising revenue throughout the year.
Body Paragraph 1
At the beginning of the year, Company B led with a revenue of 70 million USD in January, followed by Company C at 65 million USD, Company D at 55 million USD, and Company A at 50 million USD. As the months progressed, all companies saw a gradual increase in revenue. By June, Company B’s revenue had risen to 82 million USD, maintaining its lead. Company C and Company D also saw significant increases, with revenues reaching 77 million USD and 67 million USD, respectively. Company A’s revenue rose to 62 million USD by mid-year.
Body Paragraph 2
In the latter half of the year, the trend of increasing revenue continued. By December, Company B had achieved a peak revenue of 100 million USD. Company C followed with 95 million USD, Company D with 85 million USD, and Company A with 80 million USD. This consistent growth indicates a strong upward trend in online advertising revenue for all four companies throughout 2021. Company B’s revenue consistently remained the highest, while Company A, despite having the lowest revenue, showed a steady increase over the year.