IELTS Writing Task 1 yêu cầu bạn mô tả số liệu về số lượng dịch vụ mới được cung cấp hàng tháng bởi bốn công ty trong năm 2021. Bạn cần so sánh và phân tích các xu hướng, sự thay đổi và sự khác biệt giữa các công ty dựa trên biểu đồ hoặc bảng số liệu đã cho.
Bạn có thể đọc lại bài nói về Task 1 tại đây: IELTS Writing Task 1 cần lưu ý những gì?
Bạn cũng có thể đọc thêm bài viết này vì đề bài này là IELTS Writing Task 1 biểu đồ Line Graph.
IELTS Writing Task 1 Line Graph: New Services Provided
You should spent about 20 mintutes on this task
IELTS Writing Task 1 requires you to describe the data on the number of new services provided monthly by four companies in 2021. You need to compare and analyze the trends, changes, and differences between the companies based on the given chart or table.
You should write at least 150 words.
| Tháng | Công ty A | Công ty B | Công ty C | Công ty D |
| Tháng 1 | 5 | 3 | 4 | 6 |
| Tháng 2 | 6 | 4 | 3 | 5 |
| Tháng 3 | 4 | 5 | 6 | 7 |
| Tháng 4 | 7 | 6 | 5 | 4 |
| Tháng 5 | 8 | 5 | 6 | 3 |
| Tháng 6 | 6 | 4 | 7 | 5 |
| Tháng 7 | 5 | 6 | 4 | 6 |
| Tháng 8 | 7 | 7 | 6 | 8 |
| Tháng 9 | 6 | 5 | 7 | 6 |
| Tháng 10 | 8 | 6 | 8 | 7 |
| Tháng 11 | 7 | 8 | 5 | 9 |
| Tháng 12 | 9 | 7 | 6 | 8 |

Bài tham khảo 1
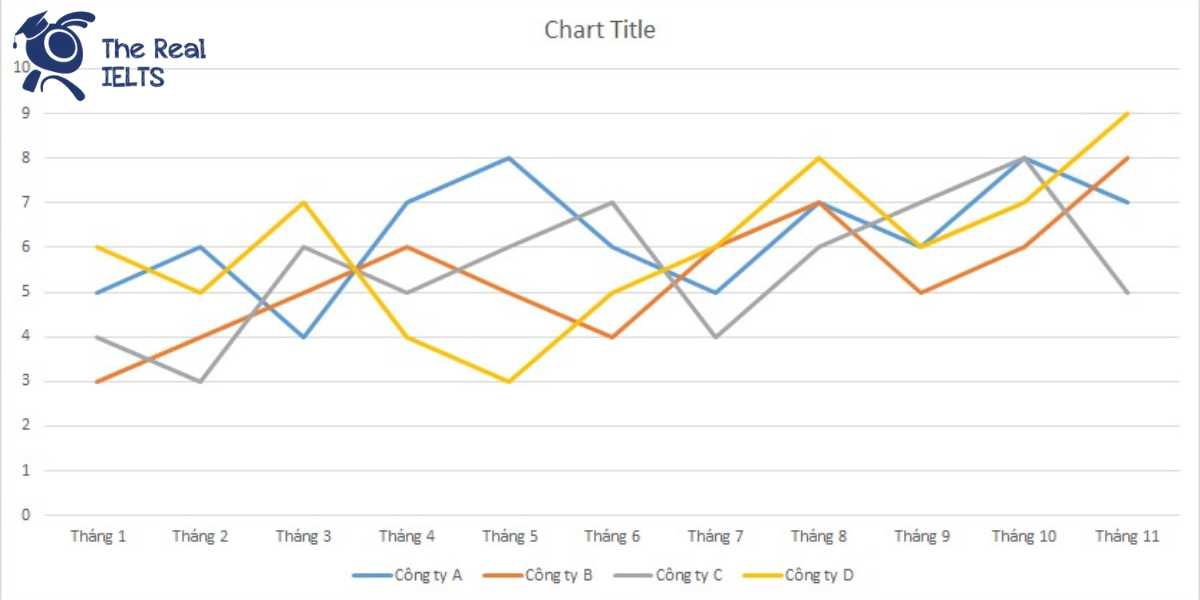
The line graph illustrates the number of new services introduced each month in 2021 by four companies: A, B, C, and D.
Overall, the number of new services launched by all four companies showed fluctuations throughout the year. However, Company D consistently launched the highest number of new services, while Company B’s figures generally remained moderate.
In the first half of the year, Company A started with 5 new services in January, peaking at 8 in May before dipping to 6 in June. Company B had a gradual increase from 3 in January to 6 in April, followed by a slight decrease to 4 in June. Company C saw an initial dip from 4 in January to 3 in February, then a steady increase to 7 in June. Company D, which started with the highest number at 6 in January, experienced a decline to 3 in May before rising back to 5 in June.
In the latter half of the year, Company A’s new services fluctuated, peaking at 9 in December. Company B showed a steady increase, reaching its peak of 8 in November before dropping to 7 in December. Company C’s figures fluctuated mildly, with a peak of 8 in October. Company D continued to lead with significant increases, reaching 9 new services in November, before ending the year with 8 in December.
In summary, while the number of new services introduced by each company varied throughout 2021, Company D consistently introduced the most new services, particularly in the latter half of the year.
Bài tham khảo 2
The line graph illustrates the number of new services provided monthly by four hypothetical companies (A, B, C, and D) throughout the year 2021.
Overall, the number of new services introduced by each company fluctuated over the year. Company A consistently increased its services with a notable peak towards the end of the year, while Company D exhibited the most significant fluctuations. Company B and C showed moderate increases with some variations.
In the first half of the year, Company A started with 5 new services in January, gradually rising to a peak of 8 in May, followed by a slight decline to 6 in June. In contrast, Company B began with 3 services in January, reached a high of 6 in April, and then decreased back to 4 in June. Company C had a varying pattern, starting with 4 services, dipping to 3 in February, and then increasing to 7 by June. Company D started highest at 6 services in January, decreased to 3 by May, and rose back to 5 in June.
In the second half of the year, Company A’s new services fluctuated between 5 and 7, culminating in a peak of 9 in December. Company B saw a general increase, reaching its highest number of 8 in November before slightly falling to 7 in December. Company C’s numbers remained relatively stable, fluctuating between 4 and 8 services, peaking in October with 8 services. Company D experienced considerable changes, with services ranging from 4 to 9, reaching its maximum in November.
In conclusion, all four companies experienced various fluctuations in the number of new services provided throughout 2021, with Company A and D showing the most notable variations.
Bài tham khảo 3
The line graph illustrates the number of new services provided monthly in 2021 by four hypothetical companies: Company A, Company B, Company C, and Company D.
Overall, Company A and Company D saw significant fluctuations in their service offerings, while Companies B and C experienced more moderate variations. Company A generally trended upwards, whereas Company D had more pronounced peaks and troughs throughout the year.
In the first half of the year, Company A started with 5 new services in January, peaking at 8 in May before dipping to 6 in June. Similarly, Company D began at 6 services in January, decreased to 3 in May, and then rebounded to 5 by June. Company B and Company C had relatively stable trends during this period, with slight increases and decreases. Company B started at 3 services in January, fluctuating slightly and reaching 5 in May. Company C started with 4 services, peaking at 6 in March and May, with some decreases in between.
In the latter half of the year, Company A saw another peak in October with 8 services and ended the year with a high of 9 in December. Conversely, Company D, after reaching 8 services in August and 9 in November, ended the year with a slight decrease to 8. Company B’s number of new services fluctuated but showed an upward trend towards the end of the year, peaking at 8 in November. Company C maintained a more consistent pattern, peaking at 8 in October and fluctuating slightly between 5 and 7 services in the remaining months.
In summary, Company A and Company D experienced the most significant changes in the number of new services provided throughout the year, while Companies B and C exhibited more stable trends with less dramatic fluctuations.