IELTS Writing Task 1 yêu cầu mô tả lượng mưa trung bình hàng tháng trong năm 2020 của bốn quốc gia. Bạn cần so sánh và nêu bật các xu hướng chính, sự khác biệt và điểm tương đồng giữa các quốc gia này. Chú ý sử dụng số liệu cụ thể và ngôn ngữ học thuật để trình bày rõ ràng và chính xác.
Bạn có thể đọc lại bài nói về Task 1 tại đây: IELTS Writing Task 1 cần lưu ý những gì?
Bạn cũng có thể đọc thêm bài viết này vì đề bài này là IELTS Writing Task 1 biểu đồ Line Graph.
IELTS Writing Task 1 Line Graph: Monthly Rainfall 2
You should spent about 20 mintutes on this task
IELTS Writing Task 1 requires describing the average monthly rainfall in 2020 for four countries. You need to compare and highlight the main trends, differences, and similarities between these countries. Pay attention to using specific data and academic language to present clearly and accurately.
You should write at least 150 words.
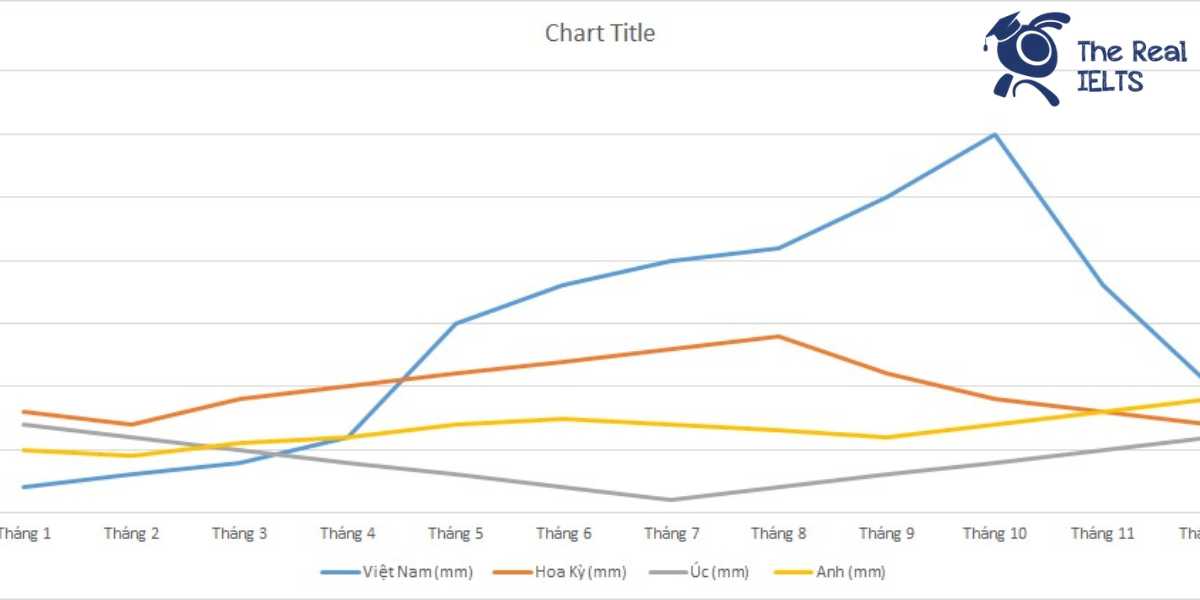
| Tháng | Việt Nam (mm) | Hoa Kỳ (mm) | Úc (mm) | Anh (mm) |
| Tháng 1 | 20 | 80 | 70 | 50 |
| Tháng 2 | 30 | 70 | 60 | 45 |
| Tháng 3 | 40 | 90 | 50 | 55 |
| Tháng 4 | 60 | 100 | 40 | 60 |
| Tháng 5 | 150 | 110 | 30 | 70 |
| Tháng 6 | 180 | 120 | 20 | 75 |
| Tháng 7 | 200 | 130 | 10 | 70 |
| Tháng 8 | 210 | 140 | 20 | 65 |
| Tháng 9 | 250 | 110 | 30 | 60 |
| Tháng 10 | 300 | 90 | 40 | 70 |
| Tháng 11 | 180 | 80 | 50 | 80 |
| Tháng 12 | 100 | 70 | 60 | 90 |

Bài tham khảo 1
Introduction
The line graph illustrates the average monthly rainfall in 2020 across four countries: Vietnam, the USA, Australia, and the UK.
Overview
Overall, Vietnam experienced the highest and most variable rainfall throughout the year, with a significant increase during the later months. In contrast, Australia had the lowest and most stable rainfall, with minimal fluctuations. The USA and the UK showed moderate and relatively stable rainfall patterns.
Body 1
In the first half of the year, Vietnam’s rainfall gradually increased from 20mm in January to 180mm in June. The USA, while starting at a higher level of 80mm in January, experienced a steadier rise, reaching 120mm by June. Australia, on the other hand, saw a consistent decrease in rainfall, starting at 70mm in January and dropping to just 20mm by June. The UK’s rainfall remained relatively stable, ranging between 45mm and 75mm during this period.
Body 2
In the second half of the year, Vietnam’s rainfall peaked, with the highest amount recorded at 300mm in October. The USA’s rainfall showed a gradual decline from 130mm in July to 70mm in December. Australia experienced a slight increase in rainfall towards the end of the year, reaching 60mm in December. The UK saw a gradual increase, peaking at 90mm in December, with the highest rainfall recorded in November at 80mm.
In summary, Vietnam had the most significant rainfall variations, particularly in the latter half of the year, while Australia had the least, with more consistent levels throughout the year. The USA and the UK displayed moderate and relatively stable rainfall patterns.
Bài tham khảo 2
Introduction
The line graph illustrates the average monthly rainfall (in millimeters) in 2020 for four countries: Vietnam, the USA, Australia, and the UK.
Overview
Overall, Vietnam experienced the highest rainfall throughout the year, particularly in the summer and early autumn months. In contrast, Australia had the lowest rainfall, with a significant decrease in the middle of the year. The USA and the UK had more moderate and relatively stable rainfall patterns.
Body 1
In the first half of the year, Vietnam’s rainfall showed a gradual increase from 20 mm in January to 150 mm in May. It then surged to 180 mm in June and peaked at 210 mm in August before reaching its highest point at 250 mm in September. Conversely, the USA’s rainfall ranged from 80 mm in January to 130 mm in July, showing a steady increase before declining to 110 mm in September.
Body 2
Australia experienced a consistent decline in rainfall from January to July, with the lowest point of 10 mm in July. The rainfall slightly increased to 30 mm in September and 40 mm in October. The UK had more stable rainfall, starting at 50 mm in January and fluctuating between 45 mm and 80 mm throughout the year, peaking at 90 mm in December.
In conclusion, the data shows significant variation in rainfall patterns among the four countries, with Vietnam having the highest and Australia the lowest average monthly rainfall in 2020.
Bài tham khảo 3
The line graph illustrates the average monthly rainfall in millimeters for four countries—Vietnam, the United States, Australia, and the United Kingdom—throughout the year 2020.
Overview: Overall, Vietnam experienced the highest levels of rainfall among the four countries, particularly during the latter half of the year. In contrast, Australia recorded the lowest rainfall, especially in the middle of the year. The United States and the United Kingdom showed more moderate and relatively stable patterns of rainfall compared to Vietnam and Australia.
Body 1: In the initial months, Vietnam’s rainfall started at 20 mm in January and gradually increased to 60 mm by April. The increase became more significant from May, reaching a peak of 300 mm in October. After October, there was a sharp decline to 180 mm in November and further to 100 mm in December. Meanwhile, the United States saw a more stable pattern with rainfall ranging from 70 mm to 140 mm. It started at 80 mm in January, peaking at 140 mm in August, and then gradually decreased to 70 mm by December.
Body 2: Australia, on the other hand, experienced the least amount of rainfall among the four countries. It began with 70 mm in January but dropped to 10 mm in July before slightly increasing again towards the end of the year. The UK had a more consistent pattern with rainfall fluctuating between 45 mm and 90 mm throughout the year. Starting at 50 mm in January, the UK’s rainfall peaked at 90 mm in December, maintaining relatively stable rainfall levels in between.
In summary, Vietnam saw significant fluctuations and the highest rainfall, especially in the latter months, while Australia experienced minimal rainfall mid-year. The US and UK displayed more moderate and stable rainfall patterns.