IELTS Writing Task 1 yêu cầu phân tích biểu đồ thể hiện số lượng trường học được xây dựng từ năm 2013 đến 2023. Thí sinh cần mô tả các xu hướng chính, so sánh số liệu giữa các năm, và đưa ra nhận xét tổng quát về sự biến động trong quá trình này. Sử dụng ngôn từ rõ ràng, súc tích và chính xác.
Bạn có thể đọc lại bài nói về Task 1 tại đây: IELTS Writing Task 1 cần lưu ý những gì?
Bạn cũng có thể đọc thêm bài viết này vì đề bài này là IELTS Writing Task 1 biểu đồ Line Graph.
IELTS Writing Task 1 Line Graph: Schools
You should spent about 20 mintutes on this task
IELTS Writing Task 1 requires analyzing a chart showing the number of schools built from 2013 to 2023. Candidates need to describe the main trends, compare the figures between the years, and provide an overall comment on the fluctuations during this period. Use clear, concise, and accurate language.
You should write at least 150 words.
| Năm | Quốc gia A | Quốc gia B | Quốc gia C | Quốc gia D |
| 2013 | 120 | 100 | 80 | 60 |
| 2014 | 130 | 105 | 85 | 65 |
| 2015 | 125 | 110 | 90 | 70 |
| 2016 | 140 | 115 | 95 | 75 |
| 2017 | 135 | 120 | 100 | 80 |
| 2018 | 150 | 125 | 105 | 85 |
| 2019 | 160 | 130 | 110 | 90 |
| 2020 | 170 | 135 | 115 | 95 |
| 2021 | 175 | 140 | 120 | 100 |
| 2022 | 180 | 145 | 125 | 105 |
| 2023 | 185 | 150 | 130 | 110 |

Bài tham khảo 1
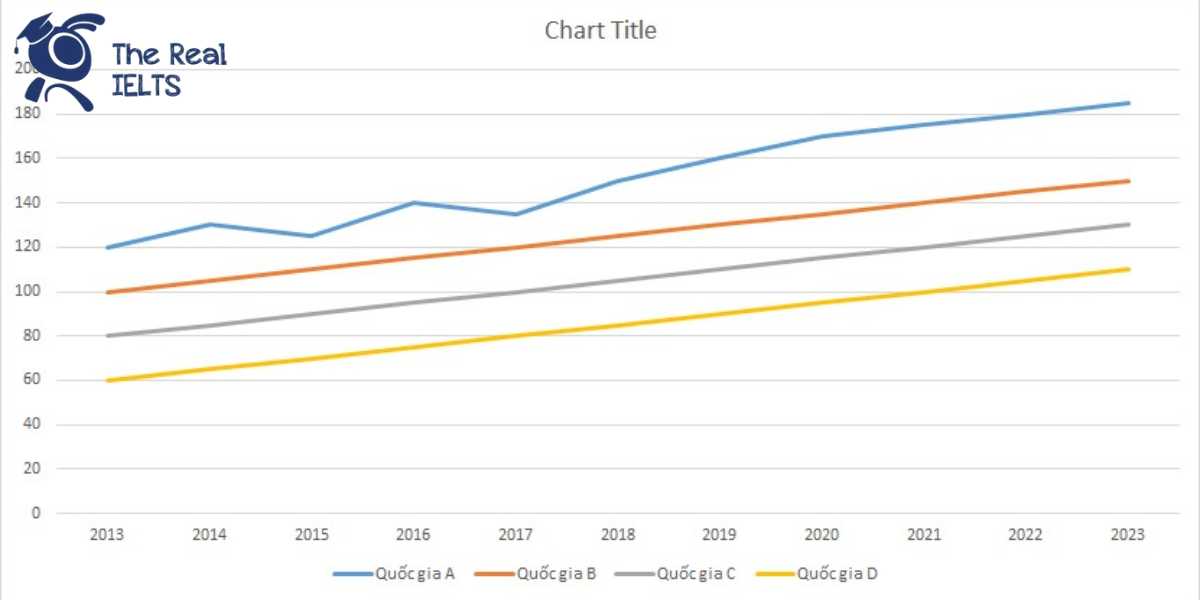
The line graph illustrates the number of schools built in four different countries, namely A, B, C, and D, over a decade from 2013 to 2023.
Overall, it is evident that the number of schools constructed in all four countries showed an upward trend throughout the period. Notably, Country A consistently had the highest number of schools built, while Country D had the lowest.
In 2013, Country A started with 120 schools, followed by Country B with 100, Country C with 80, and Country D with 60. Over the next few years, the number of schools built in Country A and Country B increased steadily, reaching 185 and 150 schools respectively by 2023. Country A experienced the most significant growth, particularly between 2018 and 2020, where the number of schools rose sharply from 150 to 170.
Similarly, Country B showed a consistent rise in the number of schools built, increasing by 5 schools each year and reaching 150 schools in 2023. Meanwhile, Country C and Country D also experienced growth, but at a slightly slower pace compared to the other two countries. Country C’s numbers increased from 80 in 2013 to 130 in 2023, while Country D’s figures rose from 60 to 110 over the same period.
In conclusion, the data indicates a general upward trend in the construction of schools across all four countries, with Country A leading in terms of the total number of schools built, and Country D having the lowest figures.
Bài tham khảo 2
The line graph illustrates the number of schools constructed in four countries, namely Country A, Country B, Country C, and Country D, over a period from 2013 to 2023.
Overall, the data indicates an upward trend in the number of schools built in all four countries throughout the ten-year period. Notably, Country A consistently had the highest number of schools built each year, while Country D had the lowest figures.
In 2013, Country A started with 120 schools, which increased steadily to reach 185 schools by 2023. Similarly, Country B saw a rise from 100 schools in 2013 to 150 schools in 2023. Although there were some fluctuations in the early years, both countries showed a general upward trend in school construction.
Country C and Country D also experienced increases in the number of schools, though at a slower pace compared to Countries A and B. Country C had 80 schools in 2013, and this number grew to 130 by 2023. Country D, which started with the lowest number of 60 schools in 2013, saw a gradual rise to 110 schools in 2023.
In conclusion, the line graph reveals a consistent growth in the number of schools built in all four countries from 2013 to 2023, with Country A leading in the number of new schools each year and Country D having the least.
Bài tham khảo 3
The line graph illustrates the number of schools constructed in four countries (A, B, C, and D) from 2013 to 2023.
Overall, all four countries experienced a steady increase in the number of schools built over the given period. Country A consistently had the highest number of schools, while Country D had the least.
In the initial year of 2013, Country A started with 120 schools, which was the highest among the four countries, followed by Country B with 100 schools, Country C with 80 schools, and Country D with 60 schools. Over the next decade, the number of schools in Country A increased steadily, reaching 185 schools by 2023. Similarly, Country B also saw a consistent rise, going from 100 schools in 2013 to 150 schools in 2023.
In contrast, Country C and Country D started with fewer schools but showed a similar upward trend. Country C increased from 80 schools in 2013 to 130 schools in 2023. Country D, although having the lowest starting point of 60 schools in 2013, also showed a gradual increase, reaching 110 schools by the end of the period.
In summary, while all four countries saw growth in the number of schools built over the ten-year period, Country A maintained its lead throughout, followed by Country B, Country C, and Country D in descending order.