IELTS Writing Task 1 yêu cầu bạn mô tả và so sánh lượng tiêu thụ nước ngọt hàng tháng trong năm 2021 của bốn quốc gia. Bạn sẽ phân tích các số liệu thể hiện xu hướng tiêu thụ, sự khác biệt giữa các quốc gia, và những thay đổi theo thời gian. Điều này đòi hỏi kỹ năng trình bày thông tin một cách rõ ràng và logic.
Bạn có thể đọc lại bài nói về Task 1 tại đây: IELTS Writing Task 1 cần lưu ý những gì?
Bạn cũng có thể đọc thêm bài viết này vì đề bài này là IELTS Writing Task 1 biểu đồ Line Graph.
Bạn cũng có thể Xây Dựng Lộ Trình Cá Nhân Hóa của mình tại link.
IELTS Writing Task 1 Line Graph: Soft Drinks
You should spent about 20 mintutes on this task
IELTS Writing Task 1 requires you to describe and compare the monthly consumption of soft drinks in 2021 across four countries. You will analyze the data to show consumption trends, differences between countries, and changes over time. This task demands the skill to present information clearly and logically.
You should write at least 150 words.
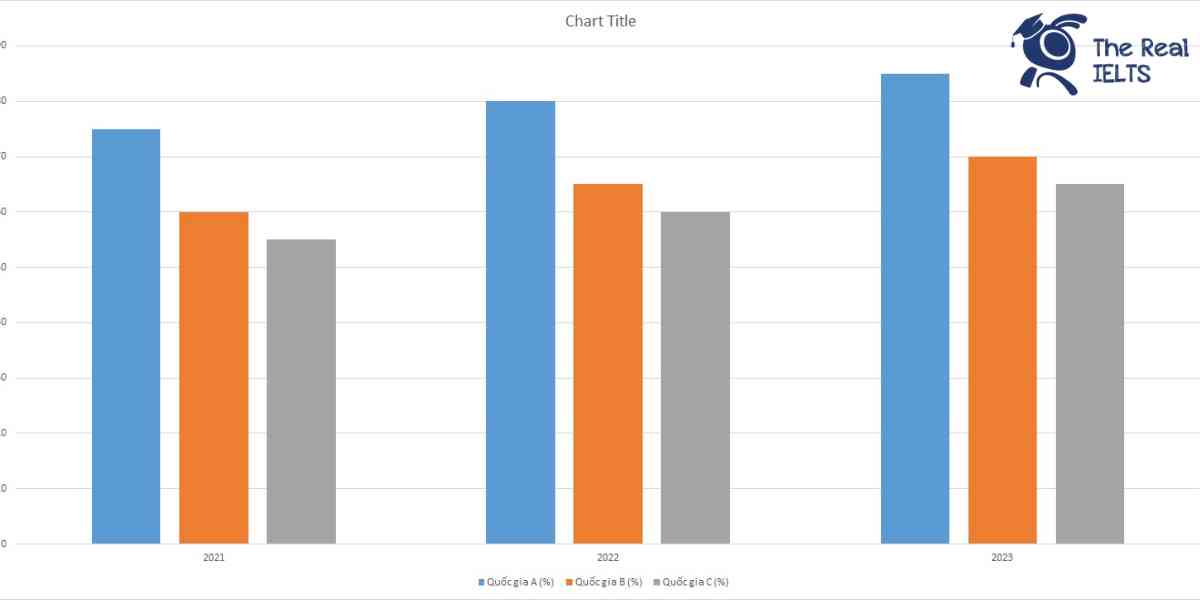
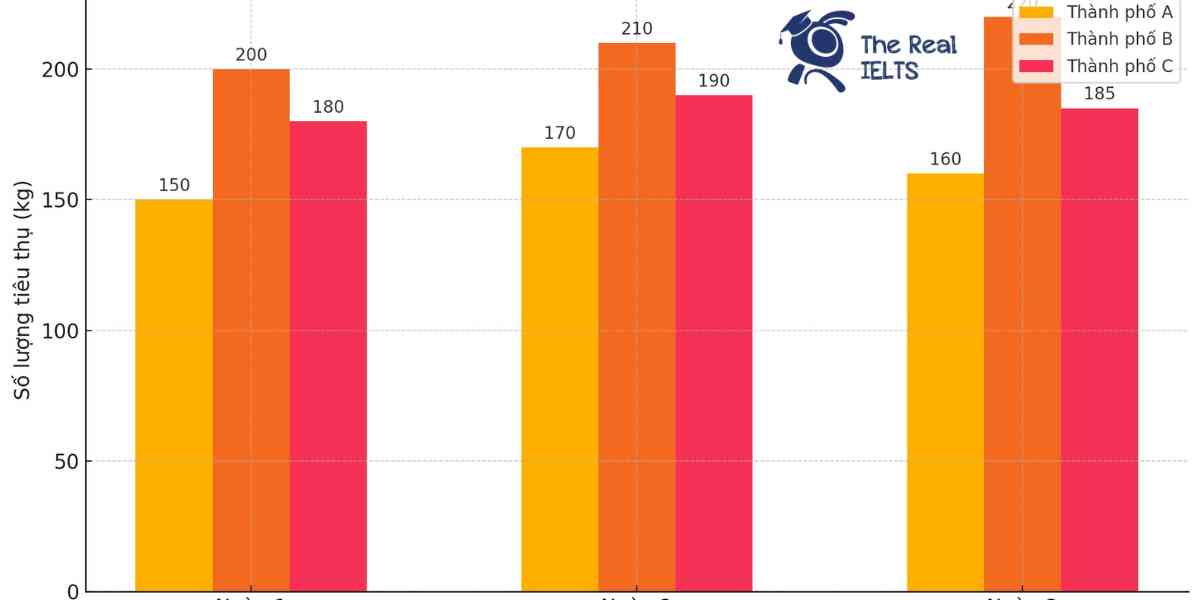
| Tháng | Quốc gia A (triệu lít) | Quốc gia B (triệu lít) | Quốc gia C (triệu lít) | Quốc gia D (triệu lít) |
| Tháng 1 | 100,000 | 80,000 | 70,000 | 60,000 |
| Tháng 2 | 105,000 | 82,000 | 72,000 | 62,000 |
| Tháng 3 | 110,000 | 85,000 | 75,000 | 65,000 |
| Tháng 4 | 115,000 | 87,000 | 78,000 | 68,000 |
| Tháng 5 | 120,000 | 90,000 | 80,000 | 70,000 |
| Tháng 6 | 125,000 | 92,000 | 82,000 | 72,000 |
| Tháng 7 | 130,000 | 95,000 | 85,000 | 75,000 |
| Tháng 8 | 135,000 | 97,000 | 88,000 | 78,000 |
| Tháng 9 | 140,000 | 100,000 | 90,000 | 80,000 |
| Tháng 10 | 145,000 | 102,000 | 92,000 | 82,000 |
| Tháng 11 | 150,000 | 105,000 | 95,000 | 85,000 |
| Tháng 12 | 155,000 | 107,000 | 98,000 | 88,000 |

Bài tham khảo 1
Introduction
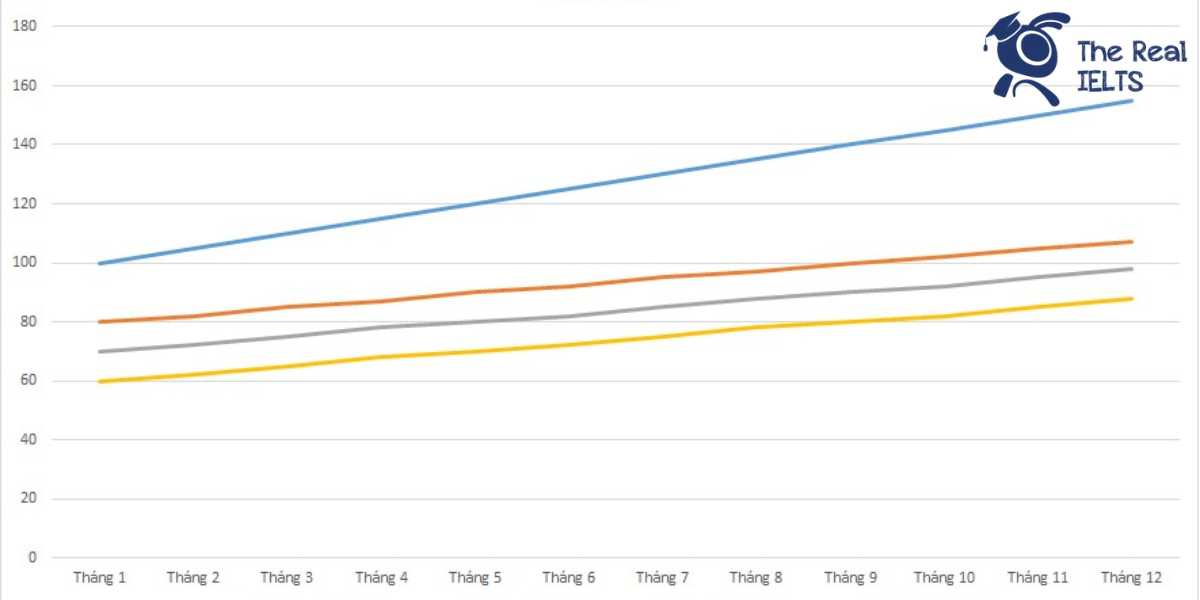
The table illustrates the monthly consumption of soft drinks in four hypothetical countries (A, B, C, and D) throughout the year 2021, measured in millions of liters.
Overview
Overall, the consumption of soft drinks in all four countries showed a consistent upward trend over the year. Country A had the highest consumption each month, while Country D consistently had the lowest.
Body 1
In January, Country A consumed 100 million liters of soft drinks, which increased steadily each month, reaching 155 million liters in December. Similarly, Country B started the year with 80 million liters in January and ended with 107 million liters in December. Country C’s consumption started at 70 million liters in January and rose to 98 million liters by December.
Body 2
Country D had the lowest consumption among the four countries, beginning at 60 million liters in January and increasing to 88 million liters by December. Despite being the lowest, the consumption trend in Country D followed a similar pattern of steady growth as observed in the other countries.
In conclusion, the data clearly indicates a continuous increase in soft drink consumption across all four countries throughout the year 2021.
Bài tham khảo 2
Introduction: The table illustrates the monthly consumption of soft drinks in million liters for four countries (A, B, C, and D) throughout the year 2021.
Overview: Overall, all four countries experienced a steady increase in soft drink consumption over the year. Country A consistently consumed the highest amount of soft drinks each month, followed by Country B, Country C, and finally Country D, which had the lowest consumption figures.
Body 1: At the beginning of the year, in January, Country A consumed 100 million liters of soft drinks, while Country B, C, and D consumed 80 million, 70 million, and 60 million liters respectively. By mid-year, in June, the consumption figures had risen for all countries: Country A reached 125 million liters, Country B 92 million liters, Country C 82 million liters, and Country D 72 million liters. This steady upward trend continued throughout the summer months.
Body 2: In the latter half of the year, the upward trend in soft drink consumption persisted. By December, Country A’s consumption peaked at 155 million liters. Similarly, Country B and C also saw their highest consumption figures in December, with 107 million and 98 million liters respectively. Country D’s consumption increased to 88 million liters by the end of the year. This consistent growth indicates a rising demand for soft drinks across all four countries throughout 2021.
Bài tham khảo 3
Introduction
The table presents the monthly soft drink consumption in four hypothetical countries (A, B, C, and D) for the year 2021, measured in million liters.
Overview
Overall, the data shows a consistent increase in soft drink consumption across all four countries throughout the year. Country A had the highest consumption in each month, while Country D consistently reported the lowest figures.
Body 1
In the first quarter of 2021, Country A’s soft drink consumption started at 100 million liters in January and rose steadily to 110 million liters by March. Meanwhile, Country B’s consumption increased from 80 million liters to 85 million liters in the same period. Country C and Country D followed similar trends, with Country C rising from 70 million liters to 75 million liters, and Country D increasing from 60 million liters to 65 million liters.
Body 2
From April to December, the upward trend continued in all countries. By December, Country A’s consumption reached 155 million liters, marking the highest increase among the four countries. Country B’s consumption climbed to 107 million liters, and Country C’s consumption rose to 98 million liters. Country D, while having the lowest figures, also showed an increase, reaching 88 million liters by the end of the year.
In conclusion, the table illustrates a clear upward trend in soft drink consumption across all four countries, with Country A leading in consumption and Country D reporting the lowest, yet steadily increasing, figures throughout 2021.
Bài tham khảo 4
The table provides data on the monthly consumption of soft drinks in four hypothetical countries (A, B, C, and D) throughout the year 2021.
Overall, there was a consistent increase in the consumption of soft drinks in all four countries over the twelve months. Country A had the highest consumption each month, while Country D had the lowest.
In the first half of the year, Country A’s soft drink consumption rose steadily from 100 million liters in January to 125 million liters in June. Similarly, Country B’s consumption increased from 80 million liters to 92 million liters, while Country C’s consumption went from 70 million liters to 82 million liters. Country D, although the lowest, also saw a gradual rise from 60 million liters to 72 million liters during the same period.
The upward trend continued in the second half of the year. By December, Country A’s consumption peaked at 155 million liters. Country B followed, reaching 107 million liters. Country C and D’s consumptions also increased, ending the year at 98 million liters and 88 million liters, respectively.
In conclusion, all four countries showed a steady increase in soft drink consumption throughout 2021, with Country A consistently leading and Country D having the lowest figures.