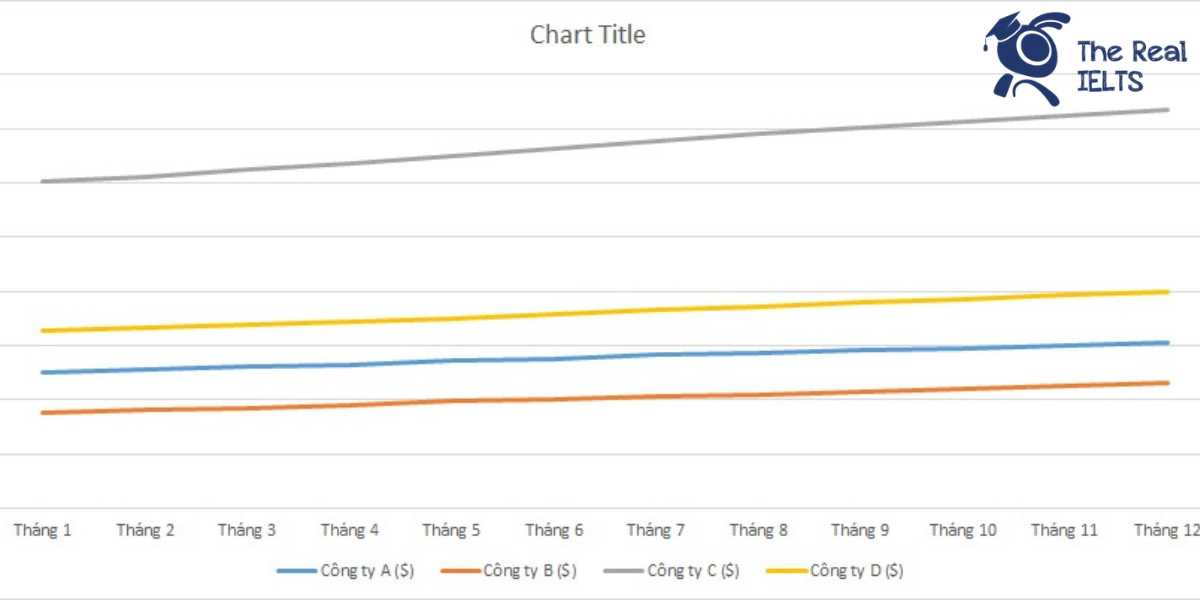
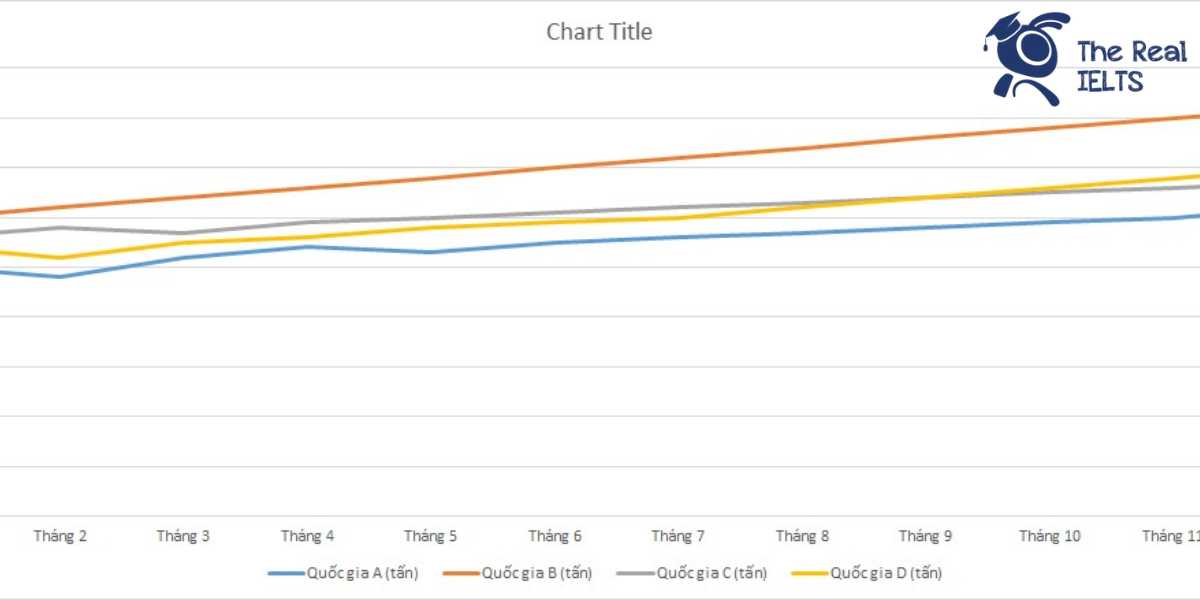
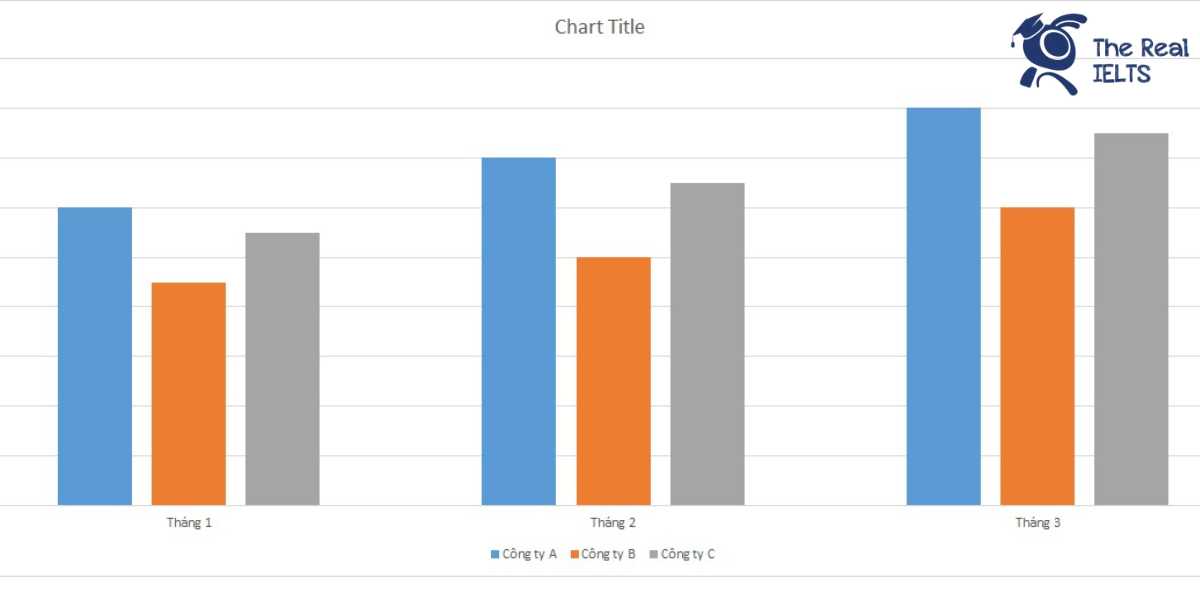
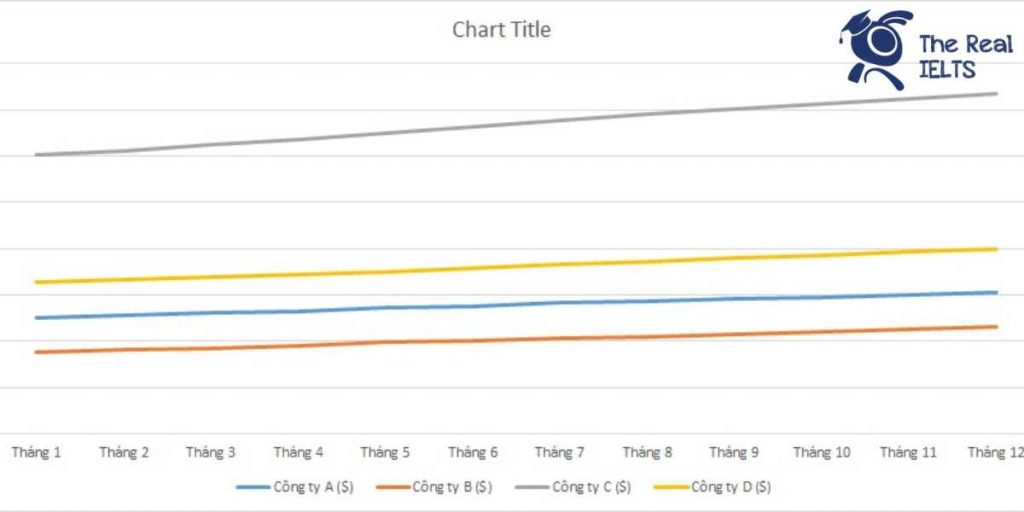
IELTS Writing Task 1 yêu cầu bạn mô tả biểu đồ giá cổ phiếu của bốn công ty khác nhau qua các tháng trong năm 2012. Bạn cần so sánh và phân tích sự thay đổi giá cổ phiếu, nhận xét về xu hướng, mức độ tăng giảm của từng công ty, và rút ra nhận xét chung.
Bạn có thể đọc lại bài nói về Task 1 tại đây: IELTS Writing Task 1 cần lưu ý những gì?
Bạn cũng có thể đọc thêm bài viết này vì đề bài này là IELTS Writing Task 1 biểu đồ Line Graph.
IELTS Writing Task 1 Line Graph
You should spent about 20 mintutes on this task
IELTS Writing Task 1 requires you to describe the stock price chart of four different companies over the months of 2012. You need to compare and analyze the changes in stock prices, comment on the trends, the degree of increase or decrease for each company, and draw a general conclusion.
You should write at least 150 words.
| Tháng | Công ty A ($) | Công ty B ($) | Công ty C ($) | Công ty D ($) |
| Tháng 1 | 50.12 | 35.45 | 120.55 | 65.40 |
| Tháng 2 | 51.34 | 36.10 | 122.20 | 66.50 |
| Tháng 3 | 52.23 | 37.05 | 125.00 | 67.80 |
| Tháng 4 | 53.10 | 38.25 | 127.35 | 68.60 |
| Tháng 5 | 54.50 | 39.50 | 130.10 | 70.20 |
| Tháng 6 | 55.20 | 40.00 | 132.75 | 71.80 |
| Tháng 7 | 56.50 | 41.25 | 135.20 | 73.10 |
| Tháng 8 | 57.40 | 42.10 | 138.00 | 74.50 |
| Tháng 9 | 58.25 | 43.05 | 140.35 | 76.00 |
| Tháng 10 | 59.10 | 44.00 | 142.50 | 77.20 |
| Tháng 11 | 60.25 | 45.10 | 145.00 | 78.50 |
| Tháng 12 | 61.00 | 46.20 | 147.25 | 80.00 |

Bài tham khảo 1
The line graph illustrates the monthly unemployment rates of four cities (A, B, C, and D) throughout the year 2021.
Overall, all four cities experienced a gradual decrease in their unemployment rates over the year. City B consistently had the highest unemployment rate, while City C had the lowest by the end of the year.
In the first half of the year, City A’s unemployment rate decreased slightly from 5.2% in January to 4.8% in June. Similarly, City B’s rate dropped from 6.1% to 5.8%. City C and City D also saw declines, with City C going from 4.8% to 4.6% and City D from 5.5% to 5.1% in the same period.
During the second half of the year, the trend continued. By December, City A’s rate had decreased to 4.2%, City B to 5.2%, City C to 4.0%, and City D to 4.5%. The most significant decrease was seen in City B, which fell by 0.9% from June to December. Meanwhile, City C maintained the lowest unemployment rate throughout the year, ending at 4.0%.
In conclusion, while all cities showed improvement in their unemployment rates, City C consistently had the lowest rates, and City B had the highest, although the gap between them narrowed by the end of the year.
Bài tham khảo 2
The line graph illustrates the monthly unemployment rates in four cities—City A, City B, City C, and City D—throughout the year 2021.
Overall, the unemployment rates in all four cities showed a declining trend over the year. City A and City B started with relatively high rates but experienced the most significant decreases, whereas City C and City D had lower initial rates and more gradual declines.
In January, City A had an unemployment rate of 5.2%, which steadily decreased each month, reaching 4.2% by December. City B began the year with the highest unemployment rate of 6.1% and also saw a consistent decline, ending the year at 5.2%. This represents a significant improvement in employment for both cities.
City C and City D started with lower unemployment rates of 4.8% and 5.5%, respectively. City C’s rate fluctuated slightly but followed a general downward trend, concluding the year at 4.0%. Similarly, City D’s unemployment rate fell consistently, from 5.5% in January to 4.5% in December.
In conclusion, the data indicates a positive trend in reducing unemployment across all four cities in 2021, with the most notable decreases observed in City A and City B.
Bài tham khảo 3
The line graph illustrates the monthly unemployment rates in four cities—City A, City B, City C, and City D—throughout the year 2021.
Overall, the unemployment rates in all four cities showed a declining trend over the year. City A and City B started with relatively high rates but experienced the most significant decreases, whereas City C and City D had lower initial rates and more gradual declines.
In January, City A had an unemployment rate of 5.2%, which steadily decreased each month, reaching 4.2% by December. City B began the year with the highest unemployment rate of 6.1% and also saw a consistent decline, ending the year at 5.2%. This represents a significant improvement in employment for both cities.
City C and City D started with lower unemployment rates of 4.8% and 5.5%, respectively. City C’s rate fluctuated slightly but followed a general downward trend, concluding the year at 4.0%. Similarly, City D’s unemployment rate fell consistently, from 5.5% in January to 4.5% in December.
In conclusion, the data indicates a positive trend in reducing unemployment across all four cities in 2021, with the most notable decreases observed in City A and City B.


