IELTS Writing Task 1 yêu cầu bạn mô tả và phân tích dữ liệu từ biểu đồ, biểu đồ cột hoặc biểu đồ đường. Ví dụ, bạn có thể phân tích số liệu giao dịch chứng khoán hàng tháng của 4 thành phố trong năm 2021. Bạn cần mô tả xu hướng tăng giảm, so sánh mức độ hoạt động chứng khoán giữa các thành phố, và điểm nhấn các sự khác biệt. Đừng quên sử dụng các thuật ngữ kỹ thuật và cấu trúc câu phức để mô tả chi tiết và logic.
Bạn có thể đọc lại bài nói về Task 1 tại đây: IELTS Writing Task 1 cần lưu ý những gì?
Bạn cũng có thể đọc thêm bài viết này vì đề bài này là IELTS Writing Task 1 biểu đồ Line Graph.
IELTS Writing Task 1 Line Graph: Stock Trading
You should spent about 20 mintutes on this task
IELTS Writing Task 1 requires you to describe and analyze data from charts, bar graphs, or line graphs. For instance, you may analyze the monthly stock trading volumes of four cities in 2021. You should depict trends, compare the level of stock market activity among cities, and highlight differences. Remember to use technical terms and complex sentence structures to describe details logically and comprehensively.
You should write at least 150 words.
| Tháng | Thành phố A | Thành phố B | Thành phố C | Thành phố D |
| Tháng 1 | 3200 | 2100 | 1500 | 4100 |
| Tháng 2 | 3100 | 2200 | 1600 | 4200 |
| Tháng 3 | 3300 | 2300 | 1700 | 4300 |
| Tháng 4 | 3400 | 2400 | 1750 | 4400 |
| Tháng 5 | 3350 | 2450 | 1800 | 4500 |
| Tháng 6 | 3250 | 2500 | 1850 | 4600 |
| Tháng 7 | 3450 | 2600 | 1900 | 4700 |
| Tháng 8 | 3550 | 2700 | 2000 | 4800 |
| Tháng 9 | 3600 | 2800 | 2100 | 4900 |
| Tháng 10 | 3700 | 2900 | 2200 | 5000 |
| Tháng 11 | 3750 | 2950 | 2250 | 5100 |
| Tháng 12 | 3800 | 3000 | 2300 | 5200 |

Bài tham khảo 1
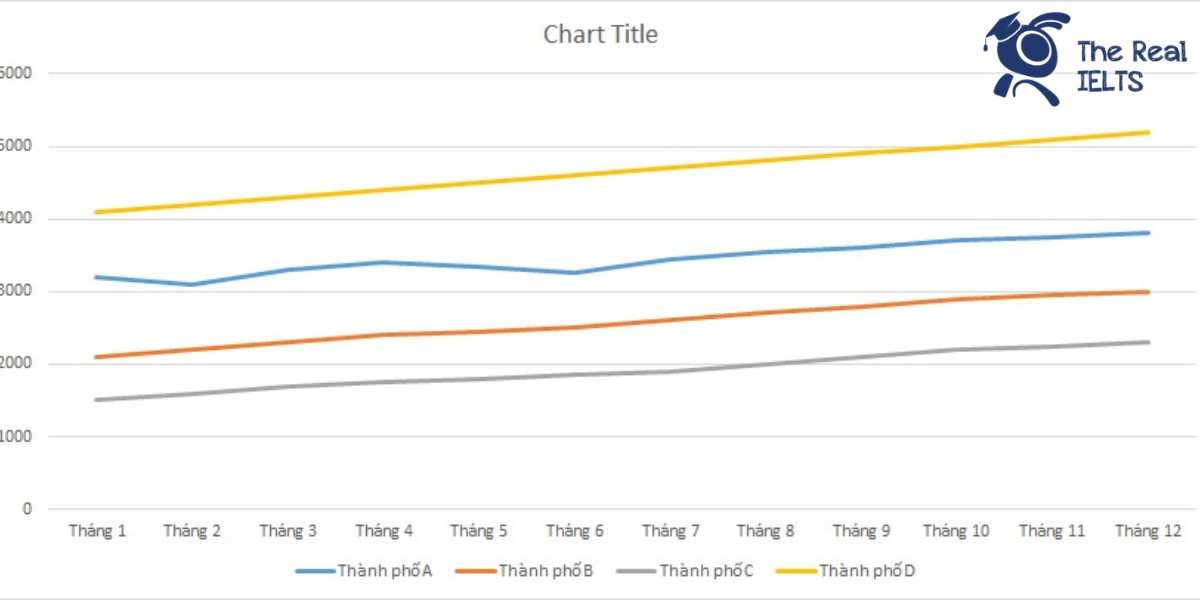
The line graph illustrates the monthly number of stock transactions in four cities, namely City A, City B, City C, and City D, over the year 2021.
Overall, all four cities experienced a general upward trend in stock transactions throughout the year. City D consistently had the highest number of transactions each month, whereas City C had the lowest. Notably, the growth rate varied among the cities.
In the first half of the year, City D led with the highest number of transactions, starting at 4100 in January and increasing steadily to 4600 by June. City A followed, starting at 3200 and reaching 3250 in June. City B and City C showed similar trends, with City B starting at 2100 and ending at 2500, while City C began at 1500 and rose to 1850.
The second half of the year saw continued growth in all cities. City D’s transactions climbed from 4700 in July to 5200 in December, maintaining its lead. City A’s transactions increased from 3450 to 3800 during the same period. City B and City C also saw growth, with City B rising from 2600 to 3000 and City C from 1900 to 2300 by year-end.
In conclusion, while all four cities showed an upward trend in stock transactions throughout 2021, City D had the most significant volume, followed by City A, City B, and City C, respectively. This indicates a robust performance in City D’s stock market activities compared to the other cities.
Bài tham khảo 2
Introduction
The line graph illustrates the monthly stock transactions in four cities (A, B, C, and D) throughout the year 2021.
Overview
Overall, all four cities experienced a steady increase in stock transactions over the year. City D consistently had the highest number of transactions, while City C had the lowest.
Body 1
At the beginning of the year, City D recorded the highest number of transactions with 4100 in January, followed by City A with 3200, City B with 2100, and City C with 1500. Throughout the first half of the year, there was a gradual increase in transactions across all cities. By June, City D’s transactions rose to 4600, City A’s to 3250, City B’s to 2500, and City C’s to 1850.
Body 2
In the second half of the year, the upward trend continued. By December, City D reached 5200 transactions, maintaining its lead. City A also saw a significant rise, ending the year at 3800 transactions. Similarly, City B and City C followed this pattern, with City B reaching 3000 and City C 2300 transactions by the end of the year. Notably, the increase in City D’s transactions was the most pronounced, with a total rise of 1100 from January to December.
In summary, while all four cities showed growth in stock transactions in 2021, City D consistently outperformed the others, with City A, B, and C trailing in descending order of transaction volume.
Bài tham khảo 3
Introduction
The line graph illustrates the monthly stock transactions in four cities – City A, City B, City C, and City D – throughout the year 2021.
Overview
Overall, all four cities experienced a general upward trend in stock transactions over the year. City D consistently had the highest number of transactions each month, while City C had the lowest. Cities A and B also showed growth, though at different rates.
Body 1
Starting with City A, the number of transactions began at 3,200 in January and showed a steady increase, reaching 3,800 by December. There was a slight fluctuation around May and June, but the trend remained upward. City B followed a similar pattern, beginning with 2,100 transactions in January and rising to 3,000 by the year’s end. The growth for City B was also consistent, with no significant dips.
Body 2
City C had the lowest figures among the four cities but also showed an upward trend. Starting at 1,500 in January, transactions increased steadily to 2,300 by December. On the other hand, City D, which had the highest transactions, started at 4,100 and climbed to 5,200 by December. The increase was steady, with City D having a clear lead over the other cities throughout the year.
In summary, while all cities saw an increase in stock transactions over the year, City D maintained the highest number of transactions each month, and City C the lowest, with Cities A and B showing moderate growth.