IELTS Writing Task 1 yêu cầu mô tả doanh số bán hàng hàng tháng của các cửa hàng tiện lợi tại bốn thành phố trong năm 2021. Bài viết cần trình bày rõ ràng và chính xác các xu hướng, sự khác biệt và điểm nổi bật trong doanh số, sử dụng các số liệu cụ thể để minh họa.
Bạn có thể đọc lại bài nói về Task 1 tại đây: IELTS Writing Task 1 cần lưu ý những gì?
Bạn cũng có thể đọc thêm bài viết này vì đề bài này là IELTS Writing Task 1 biểu đồ Line Graph.
IELTS Writing Task 1 Line Graph: Convenience Stores
You should spent about 20 mintutes on this task
IELTS Writing Task 1 requires describing the monthly sales of convenience stores in four cities in 2021. The essay should clearly and accurately present trends, differences, and highlights in the sales, using specific figures to illustrate.
You should write at least 150 words.
| Tháng | City A | City B | City C | City D |
| January | 12270 | 10578 | 10311 | 7558 |
| February | 5860 | 19423 | 10051 | 12849 |
| March | 10390 | 16636 | 11420 | 7047 |
| April | 18418 | 16363 | 6184 | 7747 |
| May | 10191 | 16111 | 9555 | 14167 |
| June | 16964 | 13322 | 8385 | 14998 |
| July | 16284 | 6685 | 17309 | 5189 |
| August | 10734 | 5769 | 11396 | 7734 |
| September | 11265 | 15583 | 18035 | 8005 |
| October | 5466 | 18803 | 16096 | 9658 |
| November | 18526 | 11949 | 13666 | 6899 |
| December | 9426 | 7433 | 14274 | 12734 |

Bài tham khảo 1
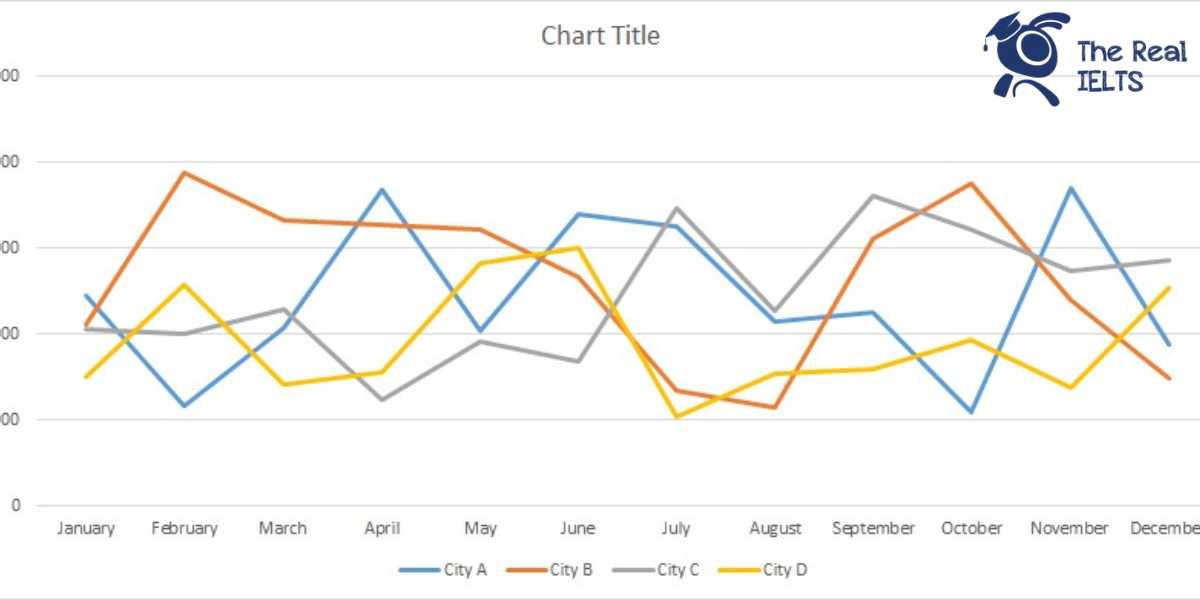
The line graph illustrates the monthly sales of convenience stores in four cities: City A, City B, City C, and City D, throughout the year 2021.
Overall, the sales figures demonstrate significant fluctuations in all cities, with each city experiencing distinct patterns of peaks and troughs over the year. Notably, City B consistently showed higher sales compared to the other cities for most of the year.
In the first half of the year, City A’s sales started at 12,270 units in January, dipped to a low of 5,860 units in February, and then reached a peak of 18,418 units in April. Sales then fluctuated, with another rise to 16,964 units in June. City B exhibited a sharp increase from 10,578 units in January to a peak of 19,423 units in February, followed by a decline and subsequent fluctuations, settling at 13,322 units in June.
In the latter half, City A’s sales varied significantly, ending at 9,426 units in December. City B’s sales peaked again at 18,803 units in October before dropping to 7,433 units in December. City C’s sales fluctuated moderately throughout the year, peaking at 18,035 units in September and concluding at 14,274 units in December. City D’s sales showed the most instability, starting at 7,558 units in January, reaching their highest point at 14,998 units in June, and closing the year at 12,734 units.
In conclusion, each city demonstrated unique sales trends in 2021, with City B generally leading in sales, despite its fluctuations. The data reflects diverse consumer behaviors and possible external factors influencing monthly sales variations.
Bài tham khảo 2
The line graph illustrates the monthly sales of convenience stores in four cities (City A, City B, City C, and City D) throughout the year 2021.
Overall, the sales figures exhibit significant fluctuations across all cities over the year, with City A and City B showing more dramatic changes compared to City C and City D. Notably, City A and City C experienced peak sales at different times of the year, while City B consistently maintained higher sales figures than the other cities.
In the first quarter, City A saw its sales start at 12,270 in January, drop sharply to 5,860 in February, then rise again to 10,390 in March. Meanwhile, City B experienced a significant increase in February with sales reaching 19,423, the highest among all cities that month, before falling to 16,636 in March. City C’s sales remained relatively stable in the first quarter, starting at 10,311 in January, slightly decreasing to 10,051 in February, and then increasing to 11,420 in March. In contrast, City D showed moderate fluctuations, with sales peaking at 12,849 in February.
In the following months, City A and City B continued to show volatile patterns. City A peaked in April at 18,418 and in November at 18,526, while City B had significant sales in October at 18,803. City C showed a major peak in September at 18,035, while its sales were more steady and lower compared to other cities. City D’s sales fluctuated throughout the year, peaking in May at 14,167 and June at 14,998, with a notable dip in July to 5,189, the lowest sales figure for City D throughout the year.
In summary, all four cities displayed varying sales trends over 2021, with City B generally having higher sales and City D showing the most consistent fluctuations. City A and City C had their peaks at different times, reflecting differing seasonal or market influences.
Bài tham khảo 3
The line graph illustrates the monthly sales figures for convenience stores in four different cities (City A, City B, City C, and City D) throughout the year 2021.
Overall, City A and City B showed the most fluctuations in sales over the year, whereas City C and City D exhibited more stable trends with occasional peaks and troughs.
In City A, the sales began at 12,270 in January, dropped significantly in February to 5,860, and then showed a general increasing trend, peaking in April at 18,418. After another peak in November at 18,526, sales ended the year at 9,426 in December. City B started with 10,578 in January and had its highest sales in February at 19,423. Although sales decreased in the following months, they spiked again in October at 18,803, finishing at a lower point of 7,433 in December.
City C’s sales were more consistent, starting at 10,311 in January, with the highest point in September at 18,035 and the lowest in April at 6,184. By December, sales had risen to 14,274. City D, with the lowest starting point of 7,558 in January, experienced its highest sales in June at 14,998 and ended the year at 12,734 in December.
In conclusion, City A and City B experienced significant variability in their monthly sales, whereas City C and City D maintained more stable sales figures with less dramatic changes throughout 2021.