IELTS Writing Task 1 yêu cầu bạn phân tích và mô tả dữ liệu từ biểu đồ, biểu đồ cột hoặc biểu đồ đường. Ví dụ, bạn có thể phân tích lượng tiêu thụ đường hàng năm của bốn quốc gia từ năm 2011 đến 2022. Bài viết cần đưa ra các con số chính, xu hướng và so sánh giữa các quốc gia. Hãy chú ý vào cách sử dụng các từ ngữ kỹ thuật và cấu trúc câu phức để thể hiện khả năng phân tích số liệu của bạn.
Bạn có thể đọc lại bài nói về Task 1 tại đây: IELTS Writing Task 1 cần lưu ý những gì?
Bạn cũng có thể đọc thêm bài viết này vì đề bài này là IELTS Writing Task 1 biểu đồ Line Graph.
Bạn cũng có thể Xây Dựng Lộ Trình Cá Nhân Hóa của mình tại link.
IELTS Writing Task 1 Line Graph: Sugar
You should spent about 20 mintutes on this task
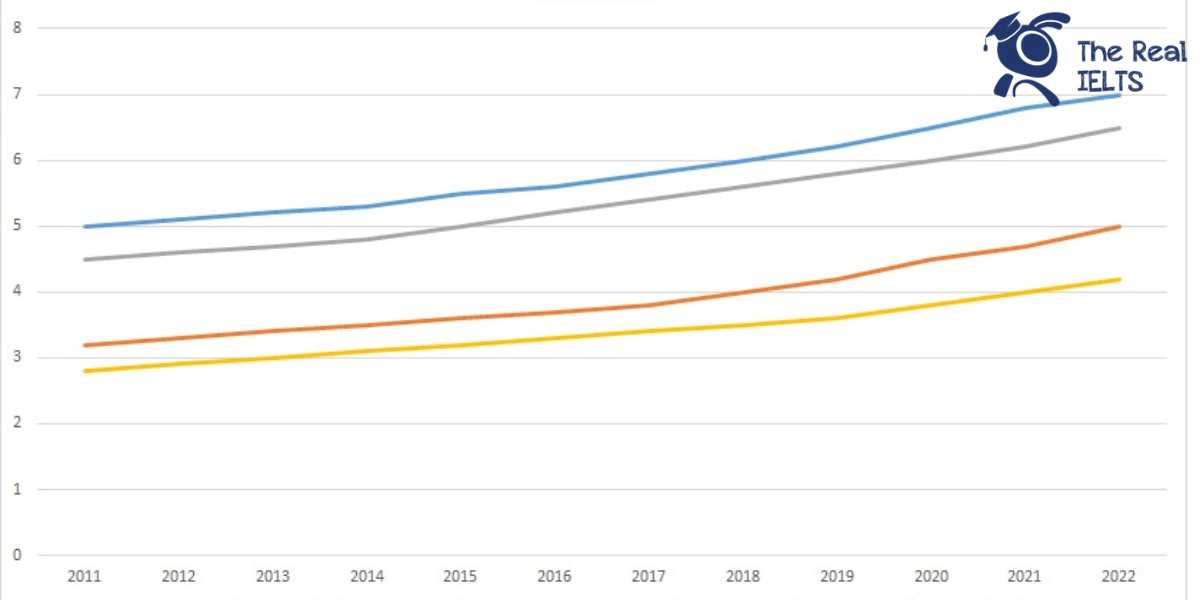
IELTS Writing Task 1 requires you to analyze and describe data from charts, bar graphs, or line graphs. For example, you might analyze the annual sugar consumption of four countries from 2011 to 2022. Your writing should present key figures, trends, and comparisons among the countries. Pay attention to using technical vocabulary and complex sentence structures to demonstrate your ability to analyze data effectively.
You should write at least 150 words.
| Năm | Quốc gia A (triệu tấn) | Quốc gia B (triệu tấn) | Quốc gia C (triệu tấn) | Quốc gia D (triệu tấn) |
| 2011 | 5,000 | 3.2 | 4.5 | 2.8 |
| 2012 | 5.1 | 3.3 | 4.6 | 2.9 |
| 2013 | 5.2 | 3.4 | 4.7 | 3,000 |
| 2014 | 5.3 | 3.5 | 4.8 | 3.1 |
| 2015 | 5.5 | 3.6 | 5,000 | 3.2 |
| 2016 | 5.6 | 3.7 | 5.2 | 3.3 |
| 2017 | 5.8 | 3.8 | 5.4 | 3.4 |
| 2018 | 6,000 | 4,000 | 5.6 | 3.5 |
| 2019 | 6.2 | 4.2 | 5.8 | 3.6 |
| 2020 | 6.5 | 4.5 | 6,000 | 3.8 |
| 2021 | 6.8 | 4.7 | 6.2 | 4,000 |
| 2022 | 7,000 | 5,000 | 6.5 | 4.2 |

Bài tham khảo 1
Introduction
The table illustrates the annual sugar consumption from 2011 to 2022 in four hypothetical countries: Country A, Country B, Country C, and Country D, measured in million tons.
Overview
Overall, sugar consumption increased steadily in all four countries over the given period. Country A consistently consumed the most sugar, while Country D had the lowest consumption throughout the years.
Body 1
In 2011, Country A had the highest sugar consumption at 5.0 million tons, which gradually rose to 7.0 million tons by 2022. Country B and Country C started with relatively lower consumption levels at 3.2 and 4.5 million tons, respectively. By 2022, these figures had increased to 5.0 million tons for Country B and 6.5 million tons for Country C. Country D, although having the lowest consumption initially at 2.8 million tons, also saw a steady rise, reaching 4.2 million tons by the end of the period.
Body 2
The increase in sugar consumption in Country A was more pronounced after 2016, with a rise from 5.6 million tons to 7.0 million tons over six years. Country B and Country C experienced consistent annual growth, with Country B’s consumption increasing by approximately 0.1 to 0.3 million tons each year and Country C’s by 0.2 to 0.3 million tons. Country D, despite having the smallest increase, showed a similar upward trend, with a notable increase of 0.2 million tons in both 2020 and 2022.
In conclusion, while all four countries showed an upward trend in sugar consumption, the rate of increase varied, with Country A leading and Country D lagging behind in total consumption.
Bài tham khảo 2
Introduction: The table illustrates the annual sugar consumption of four hypothetical countries (A, B, C, and D) from 2011 to 2022, measured in million tons.
Overview: Overall, sugar consumption increased steadily in all four countries over the given period. Country A had the highest consumption throughout the years, while Country D consistently had the lowest.
Body 1: Country A showed a significant rise in sugar consumption from 5.0 million tons in 2011 to 7.0 million tons in 2022. Similarly, Country B’s consumption increased from 3.2 million tons to 5.0 million tons over the same period. This steady growth indicates a consistent upward trend in these countries.
Body 2: Country C and Country D also experienced increases in sugar consumption, albeit at different rates. Country C’s consumption grew from 4.5 million tons in 2011 to 6.5 million tons in 2022. In contrast, Country D had the smallest increase, from 2.8 million tons to 4.2 million tons. Despite being the lowest consumer, Country D’s growth was notable, reflecting a gradual but steady rise over the years.
Bài tham khảo 3
The table presents the annual sugar consumption from 2011 to 2022 across four hypothetical countries: A, B, C, and D.
Overview:
Over the period, sugar consumption steadily increased in all four countries. Notably, Country A consistently had the highest consumption, while Country D had the lowest. Country B and C showed moderate growth, with Country C overtaking Country B in later years.
Body 1:
In 2011, Country A consumed 5.0 million tons of sugar, significantly higher than Country B (3.2 million tons), Country C (4.5 million tons), and Country D (2.8 million tons). Over the next few years, Country A’s consumption gradually rose, reaching 7.0 million tons by 2022. Similarly, Country B saw a steady increase, starting at 3.2 million tons in 2011 and reaching 5.0 million tons in 2022.
Body 2:
Country C’s sugar consumption followed a similar upward trajectory, starting at 4.5 million tons in 2011 and growing to 6.5 million tons by 2022. Country D, while having the lowest consumption throughout the period, also experienced growth from 2.8 million tons in 2011 to 4.2 million tons in 2022. The data illustrates a general upward trend in sugar consumption across all four countries over the given period.
Bài tham khảo 4
Introduction
The table illustrates the annual sugar consumption in million tons from 2011 to 2022 for four hypothetical countries: Country A, Country B, Country C, and Country D.
Overview
Overall, the data reveals a consistent upward trend in sugar consumption across all four countries over the twelve-year period. Country A consistently consumed the highest amount of sugar, while Country D had the lowest consumption each year.
Body 1
Starting with Country A, the consumption increased steadily from 5.0 million tons in 2011 to 7.0 million tons in 2022. This represents a growth of 2.0 million tons over the period. Similarly, Country B experienced a significant rise in sugar consumption, starting at 3.2 million tons in 2011 and reaching 5.0 million tons by 2022. This increase of 1.8 million tons highlights the growing demand for sugar in Country B.
Body 2
Country C also showed a steady increase in sugar consumption, rising from 4.5 million tons in 2011 to 6.5 million tons in 2022, an increase of 2.0 million tons. Meanwhile, Country D, despite having the lowest consumption among the four countries, saw a consistent rise from 2.8 million tons in 2011 to 4.2 million tons in 2022. This indicates a growing trend in sugar consumption, albeit at a slower pace compared to the other countries.
In conclusion, all four countries experienced a noticeable increase in sugar consumption from 2011 to 2022, with Country A leading in overall consumption and Country D having the lowest but still rising trend.
Bài tham khảo 5
Introduction: The table illustrates the annual sugar consumption in millions of tons for four hypothetical countries (A, B, C, and D) from 2011 to 2022.
Overview: Overall, there is a clear upward trend in sugar consumption across all four countries. Country A consistently has the highest consumption, while Country D records the lowest figures throughout the period.
Body 1: Country A experienced a steady increase in sugar consumption, rising from 5.0 million tons in 2011 to 7.0 million tons by 2022. Similarly, Country B’s consumption grew from 3.2 million tons to 5.0 million tons over the same period. This represents a gradual rise in sugar intake in both countries, with Country A maintaining a significantly higher level of consumption compared to Country B.
Body 2: Countries C and D also saw an increase in sugar consumption, but at different rates. Country C’s consumption rose from 4.5 million tons to 6.5 million tons, showing a more pronounced increase compared to Country D, which grew from 2.8 million tons to 4.2 million tons. While both countries’ consumption levels increased, the gap between Country C and D remained substantial, with Country C consistently consuming more sugar than Country D.