IELTS Writing Task 1 yêu cầu bạn miêu tả biểu đồ lưu lượng giao thông hàng tháng trong năm 2011 của bốn quốc gia. Bạn cần nêu rõ sự khác biệt và xu hướng, so sánh sự tăng giảm lưu lượng giao thông giữa các quốc gia, cũng như đưa ra nhận xét tổng quát về dữ liệu biểu đồ.
Bạn có thể đọc lại bài nói về Task 1 tại đây: IELTS Writing Task 1 cần lưu ý những gì?
Bạn cũng có thể đọc thêm bài viết này vì đề bài này là IELTS Writing Task 1 biểu đồ Line Graph.
IELTS Writing Task 1 Line Graph: Traffic
You should spent about 20 mintutes on this task
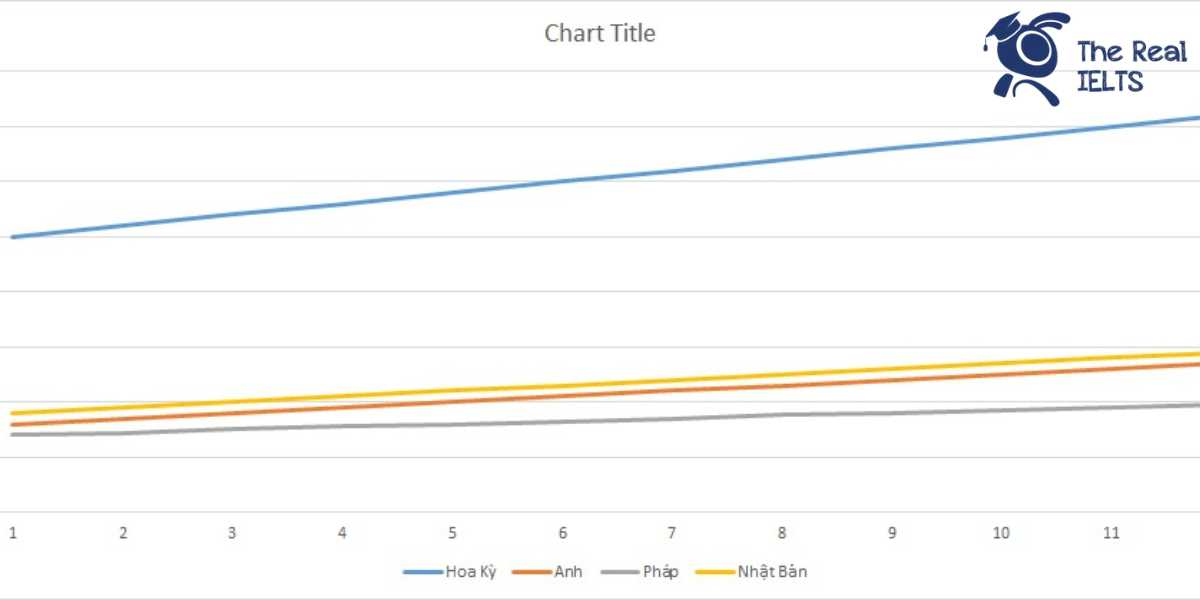
IELTS Writing Task 1 requires you to describe the monthly traffic volume chart for four countries in 2011. You need to highlight the differences and trends, compare the increase and decrease in traffic volume between the countries, and provide a general overview of the chart data.
You should write at least 150 words.
| Tháng | Hoa Kỳ | Anh | Pháp | Nhật Bản |
| 1 | 250 | 80 | 70 | 90 |
| 2 | 260 | 85 | 72 | 95 |
| 3 | 270 | 90 | 75 | 100 |
| 4 | 280 | 95 | 78 | 105 |
| 5 | 290 | 100 | 80 | 110 |
| 6 | 300 | 105 | 82 | 115 |
| 7 | 310 | 110 | 85 | 120 |
| 8 | 320 | 115 | 88 | 125 |
| 9 | 330 | 120 | 90 | 130 |
| 10 | 340 | 125 | 92 | 135 |
| 11 | 350 | 130 | 95 | 140 |
| 12 | 360 | 135 | 98 | 145 |

Bài tham khảo 1
Introduction
The line graph illustrates the monthly traffic volume in 2011 across four countries: the United States, the United Kingdom, France, and Japan, measured in millions of vehicles.
Overview
Overall, the data reveals an upward trend in traffic volume for all four countries throughout the year. The United States consistently recorded the highest traffic volume, whereas France had the lowest traffic volume among the four nations.
Body 1
In January, the United States had the highest traffic volume with 250 million vehicles, followed by Japan with 90 million, the United Kingdom with 80 million, and France with 70 million vehicles. Over the next few months, all countries experienced a gradual increase in traffic volume. By June, the United States reached 300 million vehicles, while the United Kingdom, France, and Japan recorded 105 million, 82 million, and 115 million vehicles, respectively.
Body 2
The upward trend continued into the latter half of the year. In December, the United States saw a significant rise to 360 million vehicles. Similarly, traffic in Japan increased to 145 million vehicles. The United Kingdom and France also showed growth, with 135 million and 98 million vehicles, respectively. Notably, the United States maintained the highest traffic volume throughout the year, while France had the lowest traffic volume among the four countries.
In summary, the traffic volume in all four countries increased steadily over the year 2011, with the United States consistently having the highest traffic and France the lowest.
Bài tham khảo 2
Introduction:
The line graph illustrates the monthly traffic volumes, measured in millions of vehicles, in four countries (the United States, the United Kingdom, France, and Japan) throughout the year 2011.
Overview:
Overall, the traffic volumes increased steadily in all four countries over the twelve months. The United States consistently had the highest traffic volumes each month, whereas France had the lowest. Japan and the United Kingdom showed moderate traffic volumes, with Japan having slightly higher figures than the United Kingdom towards the end of the year.
Body 1:
In January, the traffic volume in the United States was the highest at 250 million vehicles, followed by Japan at 90 million, the United Kingdom at 80 million, and France at 70 million. As the months progressed, traffic volumes in the United States rose steadily, reaching 300 million by June and peaking at 360 million in December. The United Kingdom saw a similar upward trend, starting at 80 million in January and increasing to 135 million by December.
Body 2:
France and Japan exhibited less pronounced but consistent increases in traffic volumes. France began the year with 70 million vehicles and saw a gradual rise to 98 million by December. Japan’s traffic volume started at 90 million in January and grew to 145 million by December. Although the overall traffic volume in Japan was lower than in the United States, its growth rate was significant, particularly in the last quarter of the year, where it surpassed that of the United Kingdom.
In conclusion, the data clearly indicates that all four countries experienced a steady rise in traffic volumes throughout 2011, with the United States maintaining the highest levels, and France the lowest, while Japan and the United Kingdom showed moderate traffic volumes.
Bài tham khảo 3
Introduction: The line graph illustrates the monthly traffic volume in 2011 for four countries: the United States, the United Kingdom, France, and Japan. The units are measured in millions of vehicles.
Overview: Overall, the United States had the highest traffic volume throughout the year, followed by the United Kingdom, Japan, and France. Traffic volume in all four countries showed a consistent upward trend from January to December.
Body 1: In January, the United States had the highest traffic volume with 250 million vehicles, significantly higher than the other countries. The United Kingdom, France, and Japan had traffic volumes of 80 million, 70 million, and 90 million vehicles, respectively. Over the next few months, all four countries experienced a steady increase in traffic volume. By June, the United States reached 300 million vehicles, while the United Kingdom, France, and Japan recorded 105 million, 82 million, and 115 million vehicles, respectively.
Body 2: From July to December, the upward trend continued for all four countries. In July, the traffic volume in the United States was 310 million vehicles, rising to 360 million by December. The United Kingdom’s traffic volume increased from 110 million in July to 135 million in December. France saw a rise from 85 million vehicles in July to 98 million in December, while Japan’s traffic volume increased from 120 million to 145 million over the same period. Notably, the gap between the United States and the other countries widened as the year progressed.
In conclusion, the data indicates a steady increase in traffic volume for all four countries throughout 2011, with the United States consistently leading in traffic volume.