Bài tập IELTS Writing Task 1 Line Graph: vaccine Biểu đồ đường thể hiện số lượng người được tiêm vaccine trong 1 năm. Dữ liệu cho thấy xu hướng tăng đáng kể trong việc tiêm chủng, với các giai đoạn tăng trưởng nhanh chóng và ổn định. Sự gia tăng này phản ánh nỗ lực của chính phủ và các tổ chức y tế.
Bạn có thể đọc lại bài nói về Task 1 tại đây: IELTS Writing Task 1 cần lưu ý những gì?
Bạn cũng có thể đọc thêm bài viết này vì đề bài này là IELTS Writing Task 1 biểu đồ Line Graph.
IELTS Writing Task 1 Line Graph: vaccine
You should spent about 20 mintutes on this task
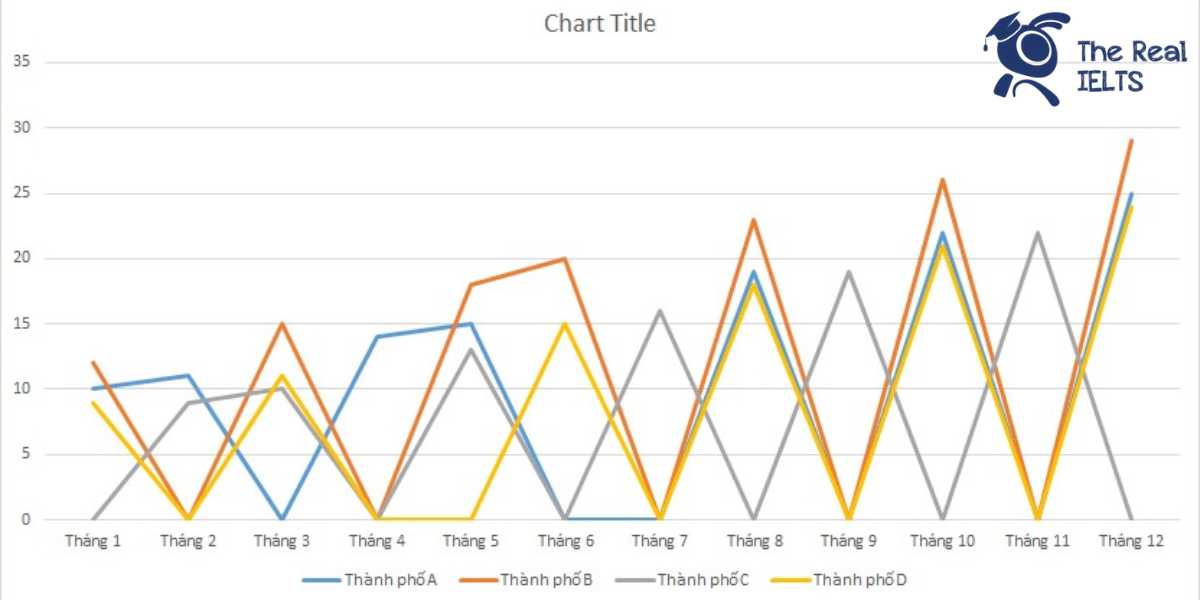
The line graph illustrates the number of people vaccinated over a year. The data shows a significant upward trend in vaccinations, with periods of rapid and steady growth. This increase reflects the efforts of the government and healthcare organizations.
You should write at least 150 words.
| Tháng | Thành phố A | Thành phố B | Thành phố C | Thành phố D |
| Tháng 1 | 10 | 12 | 8,5 | 9 |
| Tháng 2 | 11 | 13,5 | 9 | 9,5 |
| Tháng 3 | 12,5 | 15 | 10 | 11 |
| Tháng 4 | 14 | 16,5 | 11,5 | 12,5 |
| Tháng 5 | 15 | 18 | 13 | 13,5 |
| Tháng 6 | 16,5 | 20 | 14,5 | 15 |
| Tháng 7 | 17,5 | 21,5 | 16 | 16,5 |
| Tháng 8 | 19 | 23 | 17,5 | 18 |
| Tháng 9 | 20,5 | 24,5 | 19 | 19,5 |
| Tháng 10 | 22 | 26 | 20,5 | 21 |
| Tháng 11 | 23,5 | 27,5 | 22 | 22,5 |
| Tháng 12 | 25 | 29 | 23,5 | 24 |

Bài tham khảo 1
The line graph illustrates the monthly number of people vaccinated in four major cities (A, B, C, and D) throughout the year 2020.
Overall, the number of vaccinations in all four cities increased steadily from January to December. City B consistently had the highest number of vaccinations each month, while City C had the lowest numbers throughout most of the year.
In the first half of the year, City B led in vaccinations, starting at 12,000 in January and rising to 20,000 by June. City A followed, beginning at 10,000 in January and reaching 16,500 in June. City D and City C started with 9,000 and 8,500 vaccinations respectively, with City D reaching 15,000 and City C reaching 14,500 by June.
The upward trend continued in the second half of the year. City B’s vaccinations peaked at 29,000 in December, while City A’s numbers climbed to 25,000. City C and City D also saw significant increases, with City C reaching 23,500 and City D achieving 24,000 by the end of the year. Notably, City D, which had fewer vaccinations than City C in the first half of the year, surpassed City C by the end of the year.
In conclusion, while all four cities experienced a significant increase in vaccinations over the year, City B maintained the highest numbers, and City C had the lowest for most months, with City D ultimately surpassing City C.
Bài tham khảo 2
Introduction: The line graph illustrates the monthly number of vaccinations administered in four major cities – City A, City B, City C, and City D – over the course of 2020.
Overview: Overall, all four cities experienced a steady increase in the number of vaccinations throughout the year. City B consistently had the highest number of vaccinations, while City C had the lowest figures. However, the gap between the cities gradually widened, particularly in the latter half of the year.
Body 1: In January, City B led with 12,000 vaccinations, followed by City A with 10,000, City D with 9,000, and City C with 8,500. As the months progressed, the number of vaccinations in all cities increased steadily. By mid-year, in June, City B reached 20,000 vaccinations, maintaining its lead. City A also showed significant growth, reaching 16,500 vaccinations. City D and City C had lower figures, at 15,000 and 14,500 respectively.
Body 2: The upward trend continued in the second half of the year. By December, City B had nearly doubled its initial figure, achieving 29,000 vaccinations. City A followed a similar trajectory, ending the year with 25,000 vaccinations. City D and City C also saw substantial increases, with 24,000 and 23,500 vaccinations respectively. Despite the overall rise in numbers, the disparity between the cities became more pronounced towards the end of the year, particularly between the leading City B and the others.
Bài tham khảo 3
Introduction
The line graph illustrates the monthly vaccination figures in four major cities—City A, City B, City C, and City D—throughout the year 2020. The data presented is hypothetical for illustrative purposes.
Overview
Overall, the number of vaccinations increased steadily across all four cities over the course of the year. Among these cities, City B consistently had the highest vaccination figures, while City C had the lowest numbers throughout the year.
Body 1
In January, City B led with 12,000 vaccinations, followed by City A with 10,000, City D with 9,000, and City C with 8,500. Over the next few months, the vaccination numbers gradually increased. By June, City B reached 20,000 vaccinations, while City A and City D recorded 16,500 and 15,000 vaccinations respectively. City C, maintaining the lowest figures, had 14,500 vaccinations.
Body 2
The upward trend continued in the latter half of the year. By December, City B had nearly doubled its initial figure, reaching 29,000 vaccinations. City A also saw a significant rise, ending the year with 25,000 vaccinations. City D and City C recorded 24,000 and 23,500 vaccinations respectively in December. Despite the overall increase, City C consistently remained the city with the lowest monthly vaccination figures, while City B maintained its lead throughout 2020.
In conclusion, all four cities showed a consistent increase in vaccination numbers throughout 2020, with City B always leading and City C always trailing.