IELTS Writing Task 1 yêu cầu phân tích biểu đồ về lượng nước tiêu thụ hàng tháng trong năm 2010 của 4 quốc gia. Bài viết cần mô tả xu hướng, so sánh sự khác biệt và đưa ra nhận xét tổng quát về dữ liệu. Độ chính xác và rõ ràng trong việc diễn đạt là rất quan trọng.
Bạn có thể đọc lại bài nói về Task 1 tại đây: IELTS Writing Task 1 cần lưu ý những gì?
Bạn cũng có thể đọc thêm bài viết này vì đề bài này là IELTS Writing Task 1 biểu đồ Line Graph.
IELTS Writing Task 1 Line Graph: Water Consumption
You should spent about 20 mintutes on this task
IELTS Writing Task 1 requires analyzing a chart about the monthly water consumption in 2010 of four countries. The essay needs to describe trends, compare differences, and provide an overall commentary on the data. Accuracy and clarity in expression are very important.
You should write at least 150 words.
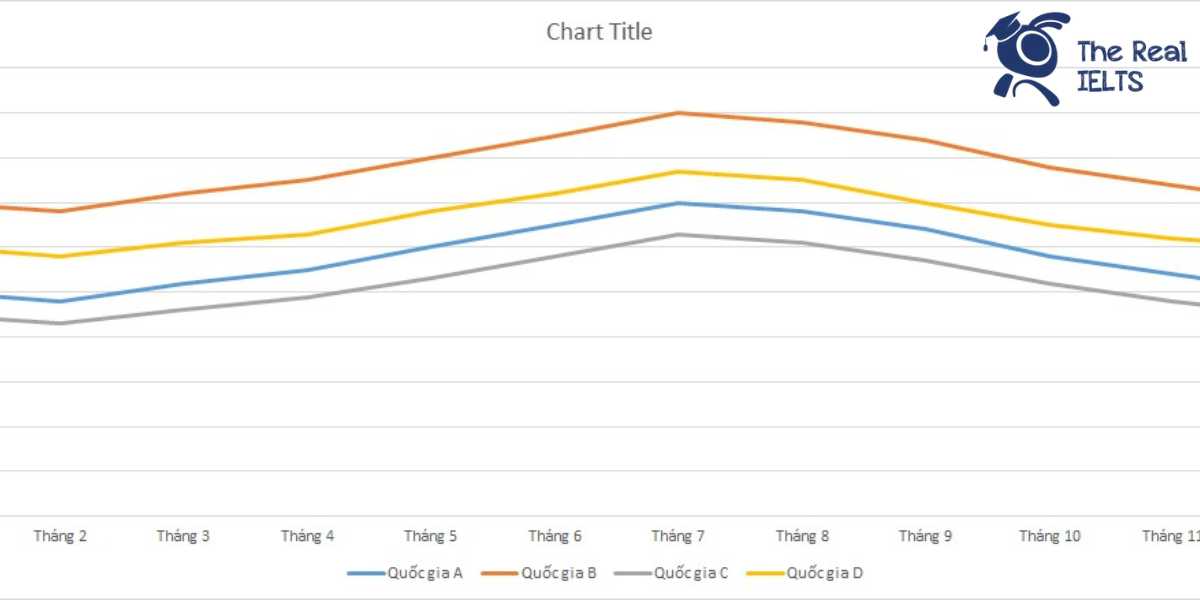
| Tháng | Quốc gia A | Quốc gia B | Quốc gia C | Quốc gia D |
| Tháng 1 | 50 | 70 | 45 | 60 |
| Tháng 2 | 48 | 68 | 43 | 58 |
| Tháng 3 | 52 | 72 | 46 | 61 |
| Tháng 4 | 55 | 75 | 49 | 63 |
| Tháng 5 | 60 | 80 | 53 | 68 |
| Tháng 6 | 65 | 85 | 58 | 72 |
| Tháng 7 | 70 | 90 | 63 | 77 |
| Tháng 8 | 68 | 88 | 61 | 75 |
| Tháng 9 | 64 | 84 | 57 | 70 |
| Tháng 10 | 58 | 78 | 52 | 65 |
| Tháng 11 | 54 | 74 | 48 | 62 |
| Tháng 12 | 50 | 70 | 45 | 60 |

Bài tham khảo 1
Introduction
The line graph illustrates the monthly water consumption of four countries (Country A, Country B, Country C, and Country D) in the year 2010, measured in million cubic meters.
Overview
Overall, Country B consistently consumed the most water throughout the year, while Country C had the lowest water consumption. The water usage in all countries showed noticeable fluctuations but followed a generally increasing trend from January to July before declining towards the end of the year.
Body 1
In the first half of the year, Country B had the highest water consumption, starting at 70 million cubic meters in January and peaking at 90 million cubic meters in July. Similarly, Country A’s water usage began at 50 million cubic meters and steadily increased to 70 million cubic meters by July. Country D’s water consumption also followed an upward trend, rising from 60 million cubic meters in January to 77 million cubic meters in July.
Body 2
In contrast, Country C had the lowest water consumption, starting at 45 million cubic meters in January and increasing to 63 million cubic meters by July. During the second half of the year, all countries experienced a decline in water consumption. By December, Country B and Country A’s water usage returned to their initial levels of 70 million cubic meters and 50 million cubic meters, respectively. Country D’s consumption dropped to 60 million cubic meters, while Country C returned to 45 million cubic meters, mirroring their January levels.
This analysis shows that despite the seasonal variations, the patterns of water consumption in these countries were somewhat predictable and followed similar trends.
Bài tham khảo 2
Introduction
The line graph illustrates the monthly water consumption in million cubic meters for four countries (A, B, C, and D) throughout the year 2010.
Overview
Overall, it can be observed that Country B consistently had the highest water consumption each month, while Country C had the lowest. Additionally, all four countries showed an increase in water usage during the summer months, peaking around July.
Body 1
In January, the water consumption for Country A was 50 million cubic meters, and it decreased slightly to 48 million cubic meters in February. However, it then followed an upward trend, reaching a peak of 70 million cubic meters in July. Subsequently, the consumption declined to 50 million cubic meters by December. Country B started with the highest consumption of 70 million cubic meters in January, and despite minor fluctuations, it continued to increase, peaking at 90 million cubic meters in July, before dropping back to 70 million cubic meters in December.
Body 2
Country C had the lowest water consumption among the four countries, starting at 45 million cubic meters in January and February, then increasing gradually to 63 million cubic meters in July. After July, it decreased to 45 million cubic meters in December. Meanwhile, Country D’s water consumption began at 60 million cubic meters in January, followed a similar trend to the other countries, reaching a high of 77 million cubic meters in July before decreasing to 60 million cubic meters in December.
In conclusion, while all countries experienced fluctuations in water consumption throughout the year, the overall trend indicates higher water usage during the summer months and lower usage in the winter months.
Bài tham khảo 3
Introduction
The line graph illustrates the monthly water consumption in four countries (A, B, C, and D) throughout the year 2010, measured in million cubic meters.
Overview
Overall, water consumption in all four countries showed fluctuations over the year. Country B consistently had the highest water usage, while Country C recorded the lowest. Notably, water consumption peaked during the summer months for all countries.
Body 1
In January, Country B had the highest water consumption at 70 million cubic meters, followed by Country D with 60 million, Country A with 50 million, and Country C with 45 million cubic meters. From January to July, there was a steady increase in water consumption in all four countries. Country B’s consumption rose from 70 million to 90 million cubic meters, while Country A’s increased from 50 million to 70 million cubic meters. Similarly, Country D’s consumption went up from 60 million to 77 million cubic meters, and Country C’s from 45 million to 63 million cubic meters.
Body 2
After reaching their peaks in July, all four countries experienced a decline in water consumption. By December, Country B’s water usage had dropped back to 70 million cubic meters, the same level as in January. Country A’s consumption decreased to 50 million cubic meters, and Country D’s to 60 million cubic meters, both returning to their January levels. Meanwhile, Country C’s water usage fell to 45 million cubic meters, mirroring the figures at the start of the year. The trends indicate a clear seasonal pattern, with higher water consumption during the warmer months and lower usage during the colder months.