IELTS Writing Task 1 yêu cầu bạn phân tích một biểu đồ bar chart thể hiện số lượng khách hàng khiếu nại trong ba tháng tại ba công ty khác nhau. Biểu đồ này minh họa sự biến động về số lượng khiếu nại của khách hàng, giúp bạn rèn luyện kỹ năng miêu tả và so sánh dữ liệu. Khi viết, bạn cần chú ý đến việc sử dụng ngôn ngữ chính xác và cấu trúc bài viết logic để truyền đạt thông tin một cách rõ ràng và hiệu quả.
Đọc bài này Cách làm bài IELTS Writing Task 1 Bar Chart trước khi làm bài.
Bạn cũng có thể đọc lại bài nói về Task 1 tại đây: IELTS Writing Task 1 cần lưu ý những gì?
Đọc thêm về xây dựng lộ trình học IELTS của The Real IELTS.
IELTS Writing Task 1 Bar Chart: Complaints
You should spent about 20 mintutes on this task
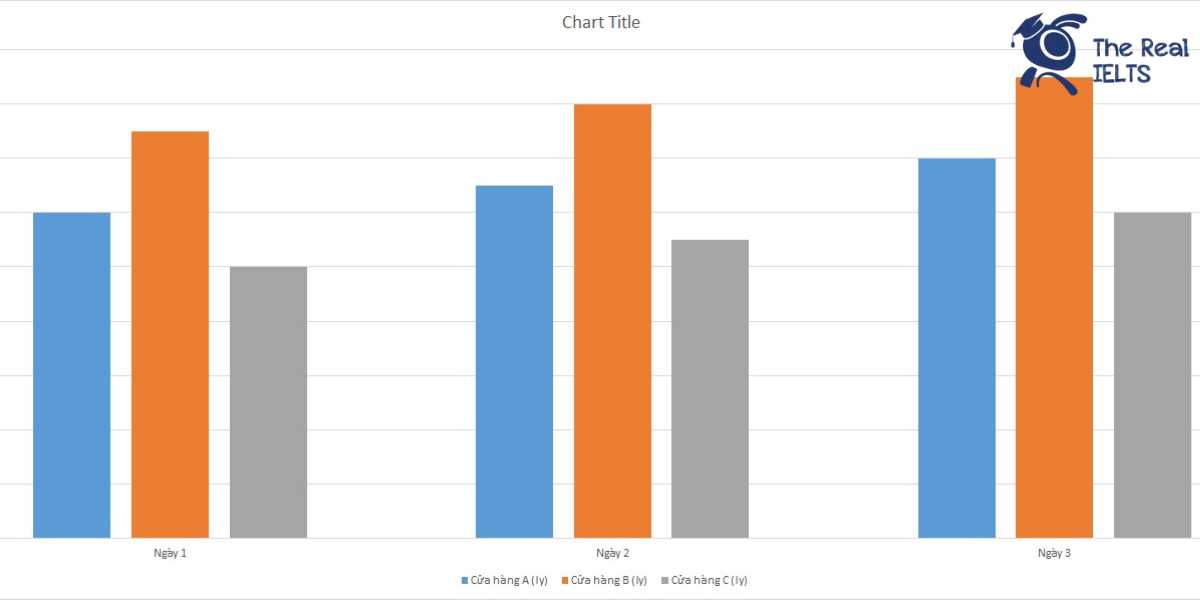
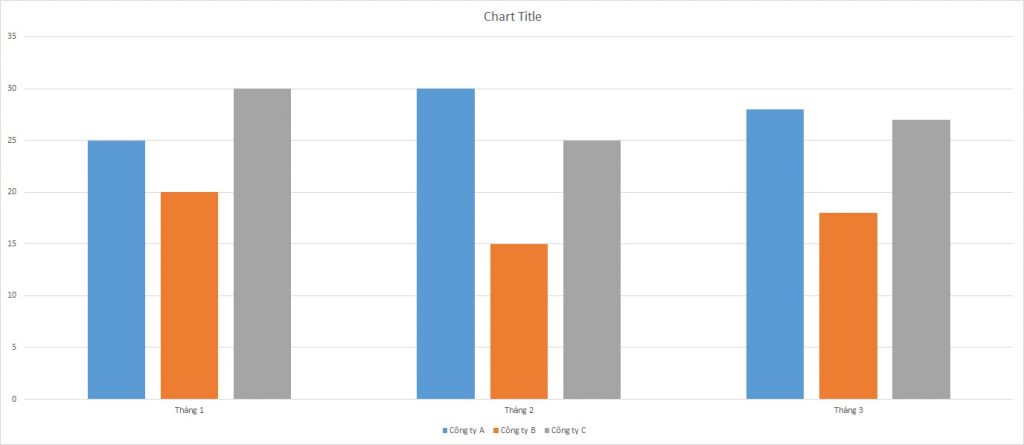
IELTS Writing Task 1 requires you to analyze a bar chart illustrating the number of customer complaints over three months at three different companies. This chart depicts the fluctuations in the number of customer complaints, helping you practice descriptive and comparative data skills. When writing, you need to pay attention to using precise language and a logical structure to convey information clearly and effectively.
You should write at least 150 words.
| Thời gian / Công ty | Công ty A | Công ty B | Công ty C |
| Tháng 1 | 25 | 20 | 30 |
| Tháng 2 | 30 | 15 | 25 |
| Tháng 3 | 28 | 18 | 27 |
Bài mẫu 1
Overview
Customer complaints are a significant metric for evaluating the quality of service provided by companies. They provide insights into customer satisfaction and areas needing improvement. This report analyzes the number of customer complaints received by three companies (Company A, Company B, and Company C) over a period of three months.
Body 1
In January, the number of complaints varied significantly among the three companies. Company A received 25 complaints, indicating a moderate level of customer dissatisfaction. Company B had slightly fewer complaints, with a total of 20, suggesting relatively better customer service or fewer service issues. On the other hand, Company C faced the highest number of complaints at 30, pointing to potential challenges in maintaining customer satisfaction.
Body 2
The trend of customer complaints continued to fluctuate over the following two months. In February, Company A saw an increase in complaints, rising to 30, which might reflect worsening service issues or higher customer expectations. Conversely, Company B’s complaints decreased to 15, possibly indicating improvements in their service or effective resolution of previous issues. Company C experienced a decrease to 25 complaints, yet it remained higher compared to Company B, suggesting ongoing challenges. By March, the complaints for Company A slightly decreased to 28, while Company B saw a small increase to 18. Company C had 27 complaints, showing a relatively stable but high level of customer dissatisfaction compared to the others.
Overall, these statistics highlight varying levels of customer service effectiveness among the three companies, with Company B generally performing better in terms of minimizing customer complaints.
Bài mẫu 2
Overview
This report analyzes the number of customer complaints over three months for three companies: Company A, Company B, and Company C. The data provides insights into the trends and variations in customer satisfaction levels across the companies.
Body 1
In January, Company C received the highest number of complaints, totaling 30, while Company A and Company B received 25 and 20 complaints, respectively. This indicates that Company C faced more customer dissatisfaction compared to the other two companies at the beginning of the year. On the other hand, Company B had the least number of complaints, suggesting a relatively higher customer satisfaction level in January.
Body 2
The trend changes slightly in February, where Company A experienced an increase in complaints, reaching 30, making it the company with the highest number of complaints for that month. Company C saw a decrease in complaints to 25, while Company B’s complaints dropped to 15, marking the lowest among the three companies. In March, Company A’s complaints slightly decreased to 28, while Company B’s complaints rose to 18. Company C’s complaints remained relatively stable, increasing slightly to 27. This month-by-month analysis highlights the dynamic nature of customer satisfaction and the need for continuous improvement in customer service across all companies.