IELTS Writing Task 1 yêu cầu thí sinh mô tả biểu đồ Bar Chart về số lượt tải ứng dụng trong ba ngày của ba ứng dụng khác nhau. Thí sinh cần nêu rõ số liệu cụ thể, so sánh sự thay đổi và xu hướng tải xuống của từng ứng dụng trong khoảng thời gian đó. Chú ý sử dụng từ ngữ chính xác và mạch lạc.
Đọc bài này Cách làm bài IELTS Writing Task 1 Bar Chart trước khi làm bài.
Bạn cũng có thể đọc lại bài nói về Task 1 tại đây: IELTS Writing Task 1 cần lưu ý những gì?
IELTS Writing Task 1 Bar Chart: Downloads
You should spent about 20 mintutes on this task
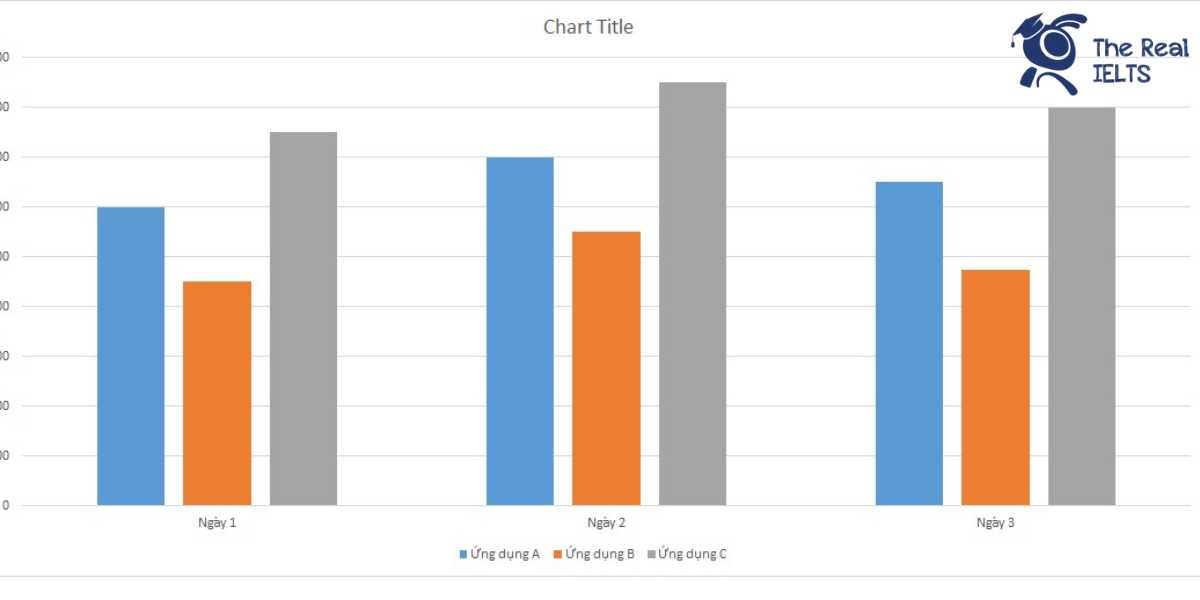
IELTS Writing Task 1 requires candidates to describe a Bar Chart showing the number of downloads of three different applications over three days. Candidates need to provide specific data, compare the changes, and discuss the download trends of each application during that period. Attention to precise and coherent language is important.
You should write at least 150 words.
| Ngày | Ứng dụng A | Ứng dụng B | Ứng dụng C |
| Ngày 1 | 1200 | 900 | 1500 |
| Ngày 2 | 1400 | 1100 | 1700 |
| Ngày 3 | 1300 | 950 | 1600 |

Bài mẫu 1
Introduction
The table presents data on the number of downloads for three different applications, namely Application A, Application B, and Application C, over a span of three days.
Overview
Overall, Application C consistently had the highest number of downloads each day, while Application B had the lowest. Both Applications A and C saw a general increase in downloads from Day 1 to Day 2, followed by a slight decline on Day 3. In contrast, Application B showed a less significant variation over the three days.
Body 1
On the first day, Application C led with 1,500 downloads, followed by Application A with 1,200 downloads, and Application B with 900 downloads. The second day saw all three applications experiencing an increase in downloads: Application C rose to 1,700 downloads, Application A increased to 1,400 downloads, and Application B reached 1,100 downloads.
Body 2
However, on the third day, there was a minor decline in downloads for both Application A and Application C. Application A’s downloads decreased to 1,300, and Application C’s downloads dropped to 1,600. Application B also experienced a slight decrease, with downloads falling to 950. Despite these fluctuations, Application C remained the most downloaded application throughout the three-day period.
Bài mẫu 2
Introduction: The table provides data on the number of downloads for three different applications (A, B, and C) over a span of three days.
Overview: Overall, Application C consistently had the highest number of downloads each day, while Application B had the lowest. All three applications experienced fluctuations in their download numbers throughout the given period.
Body 1: On the first day, Application C had the highest number of downloads at 1,500, followed by Application A with 1,200 downloads. Application B lagged behind with only 900 downloads. The second day saw an increase in downloads for all three applications, with Application C maintaining its lead at 1,700 downloads. Application A also experienced a rise to 1,400 downloads, whereas Application B reached 1,100 downloads.
Body 2: On the third day, there was a slight decrease in downloads for Applications A and C, which dropped to 1,300 and 1,600 respectively. Application B also saw a decline, falling to 950 downloads. Despite these fluctuations, Application C remained the most downloaded application each day, while Application B consistently had the lowest number of downloads.
In summary, the data indicates that Application C was the most popular among users during the three-day period, whereas Application B had the least number of downloads each day.
Bài mẫu 3
Introduction
The table illustrates the number of downloads for three different applications (A, B, and C) over a period of three days.
Overview
Overall, Application C consistently had the highest number of downloads each day, followed by Application A and then Application B. All three applications showed varying trends in their download numbers over the three days.
Body 1
On the first day, Application C led with 1,500 downloads, followed by Application A with 1,200 downloads, and Application B with 900 downloads. On the second day, the number of downloads increased for all three applications. Application C still held the lead with 1,700 downloads, Application A saw an increase to 1,400 downloads, and Application B’s downloads rose to 1,100.
Body 2
However, on the third day, there were slight changes in the download numbers. Application C experienced a minor decrease to 1,600 downloads but remained the most downloaded. Application A also saw a slight drop to 1,300 downloads. Meanwhile, Application B’s downloads fell slightly to 950. Despite these fluctuations, the overall ranking of the applications by the number of downloads remained unchanged across the three days.