IELTS Writing Task 1 yêu cầu bạn mô tả biểu đồ hoặc bảng số liệu. Đề bài này yêu cầu phân tích số ca nhiễm bệnh cúm hàng tháng trong năm 2020 của 4 quốc gia. Bạn cần so sánh, nhấn mạnh các xu hướng, điểm nổi bật và biến động chính, sử dụng ngôn ngữ chính xác và mạch lạc.
Bạn có thể đọc lại bài nói về Task 1 tại đây: IELTS Writing Task 1 cần lưu ý những gì?
Bạn cũng có thể đọc thêm bài viết này vì đề bài này là IELTS Writing Task 1 biểu đồ Line Graph.
IELTS Writing Task 1 Line Graph: Flu Infection
You should spent about 20 mintutes on this task
IELTS Writing Task 1 requires you to describe a chart or table. This task asks you to analyze the monthly flu infection cases in 2020 of four countries. You need to compare, highlight trends, key points, and major fluctuations, using precise and coherent language.
You should write at least 150 words.
| Tháng | Quốc gia 1 | Quốc gia 2 | Quốc gia 3 | Quốc gia 4 |
| Tháng 1 | 1500 | 2000 | 1700 | 1800 |
| Tháng 2 | 1400 | 1900 | 1600 | 1700 |
| Tháng 3 | 1300 | 1800 | 1500 | 1600 |
| Tháng 4 | 1200 | 1700 | 1400 | 1500 |
| Tháng 5 | 1100 | 1600 | 1300 | 1400 |
| Tháng 6 | 1000 | 1500 | 1200 | 1300 |
| Tháng 7 | 900 | 1400 | 1100 | 1200 |
| Tháng 8 | 800 | 1300 | 1000 | 1100 |
| Tháng 9 | 700 | 1200 | 900 | 1000 |
| Tháng 10 | 600 | 1100 | 800 | 900 |
| Tháng 11 | 500 | 1000 | 700 | 800 |
| Tháng 12 | 400 | 900 | 600 | 700 |

Bài tham khảo 1
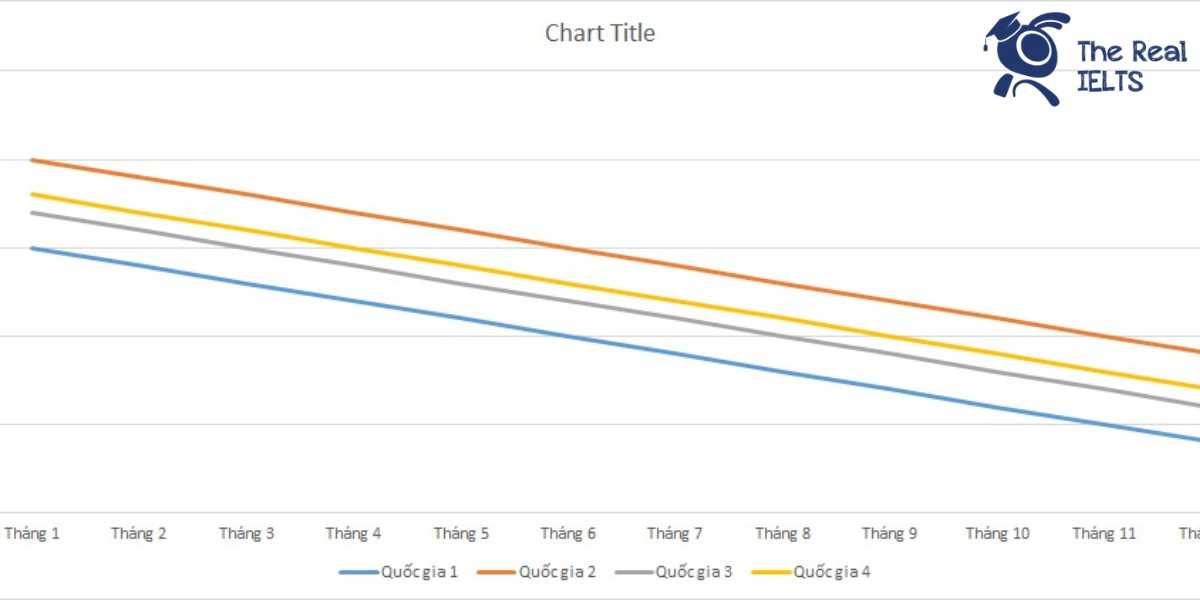
The line graph illustrates the number of flu cases reported each month in 2020 across four different countries.
Overview: Overall, all four countries showed a significant decline in the number of flu cases from January to December. The trend is consistent across all countries, with each experiencing the highest number of cases in January and the lowest in December.
Body 1: In January, Country 2 had the highest number of flu cases at 2000, followed by Country 4 at 1800, Country 3 at 1700, and Country 1 at 1500. As the months progressed, the number of cases steadily decreased in all countries. By mid-year in June, Country 2 still led with 1500 cases, whereas Country 1 had the lowest at 1000.
Body 2: The downward trend continued into the latter half of the year. By October, the number of flu cases dropped to 1100 in Country 2, 600 in Country 1, 800 in Country 3, and 900 in Country 4. The year ended with the lowest figures in December, where Country 2 reported 900 cases, Country 1 reported 400, Country 3 reported 600, and Country 4 reported 700. This data indicates a consistent decrease in flu cases across all four countries throughout 2020.
Bài tham khảo 2
The line graph illustrates the number of flu cases reported each month in 2020 for four countries.
Overall, all four countries experienced a consistent decline in the number of flu cases over the year. Country 1 had the highest number of cases in January but ended the year with the fewest. Conversely, Country 2 consistently reported the highest number of flu cases each month.
In January, Country 1 reported 1500 cases, followed by Country 3 with 1700, Country 4 with 1800, and Country 2 with 2000. By June, the number of cases had dropped to 1000 in Country 1, 1500 in Country 2, 1200 in Country 3, and 1300 in Country 4. This downward trend continued for the remainder of the year.
By December, the number of flu cases had significantly decreased across all countries. Country 1 had only 400 cases, Country 3 had 600, Country 4 had 700, and Country 2, although still leading in the number of cases, had decreased to 900. The overall trend indicates a steady decline in flu cases throughout the year for all four countries.
Bài tham khảo 3
Introduction
The line graph illustrates the monthly number of flu cases in 2020 across four countries.
Overview
Overall, the data reveals a consistent downward trend in flu cases across all four countries throughout the year. Country 1 and Country 2 started with the highest number of cases, whereas Country 3 and Country 4 followed a similar pattern but with fewer cases. By the end of the year, all countries experienced a significant reduction in the number of flu cases.
Body 1
In January, Country 1 recorded the highest number of flu cases at 1500, followed by Country 2 with 2000 cases. Country 3 and Country 4 had slightly lower numbers, with 1700 and 1800 cases respectively. From January to June, there was a steady decline in flu cases in all four countries. By June, the number of cases had dropped to 1000 in Country 1, 1500 in Country 2, 1200 in Country 3, and 1300 in Country 4.
Body 2
The downward trend continued in the second half of the year. In December, the flu cases dropped to their lowest point: 400 in Country 1, 900 in Country 2, 600 in Country 3, and 700 in Country 4. Country 1 experienced the steepest decline overall, whereas Country 2 had the smallest relative decrease in flu cases over the year. Despite these differences, all four countries showed a similar pattern of a gradual decrease in flu cases from January to December.