IELTS Writing Task 1 yêu cầu mô tả biểu đồ về tỷ lệ người hút thuốc lá theo 4 độ tuổi từ năm 2011 đến năm 2022. Bài viết cần trình bày xu hướng, sự khác biệt giữa các nhóm tuổi, và những thay đổi qua thời gian. Đảm bảo sự rõ ràng, chính xác và mạch lạc trong việc diễn đạt số liệu và so sánh.
Bạn có thể đọc lại bài nói về Task 1 tại đây: IELTS Writing Task 1 cần lưu ý những gì?
Bạn cũng có thể đọc thêm bài viết này vì đề bài này là IELTS Writing Task 1 biểu đồ Line Graph.
Bạn cũng có thể Xây Dựng Lộ Trình Cá Nhân Hóa của mình tại link.
IELTS Writing Task 1 Line Graph: Smoking Rates
You should spent about 20 mintutes on this task
IELTS Writing Task 1 requires describing a chart about the smoking rates among four age groups from 2011 to 2022. The essay should present trends, differences between age groups, and changes over time. Ensure clarity, accuracy, and coherence in conveying the data and making comparisons.
You should write at least 150 words.
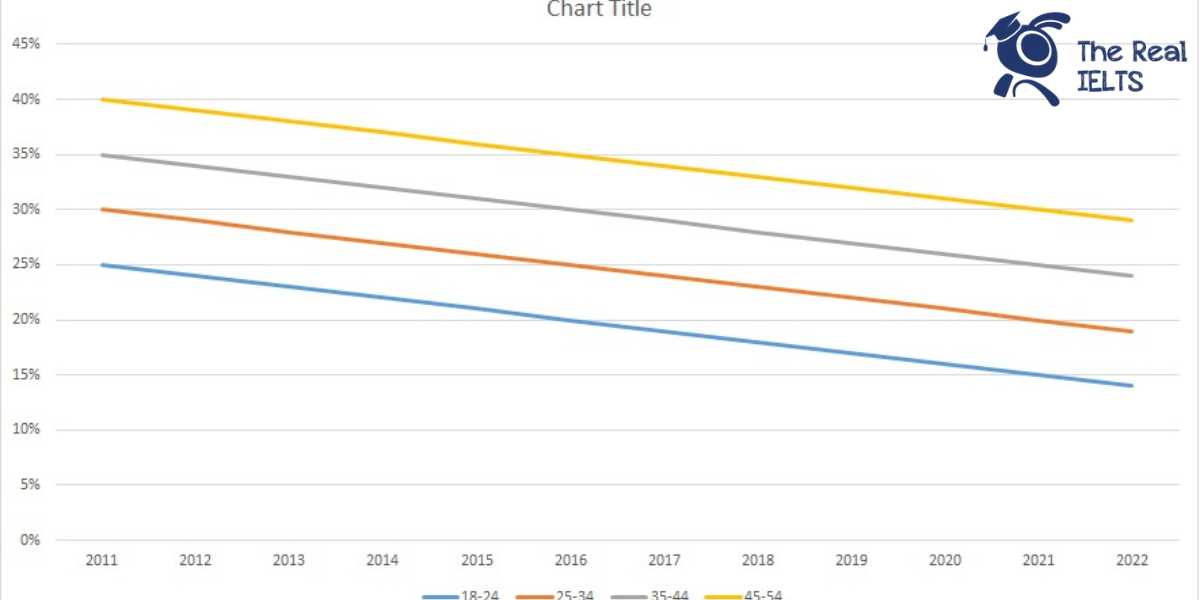
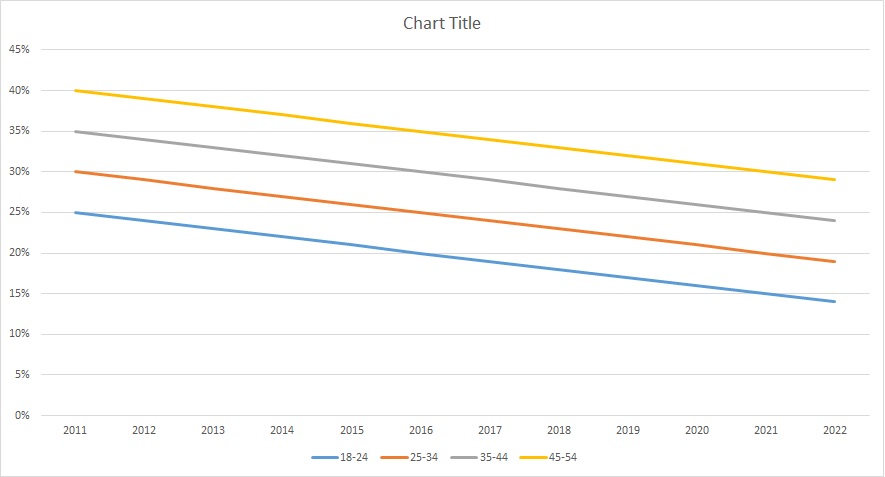
| Năm | 18-24 | 25-34 | 35-44 | 45-54 |
| 2011 | 25% | 30% | 35% | 40% |
| 2012 | 24% | 29% | 34% | 39% |
| 2013 | 23% | 28% | 33% | 38% |
| 2014 | 22% | 27% | 32% | 37% |
| 2015 | 21% | 26% | 31% | 36% |
| 2016 | 20% | 25% | 30% | 35% |
| 2017 | 19% | 24% | 29% | 34% |
| 2018 | 18% | 23% | 28% | 33% |
| 2019 | 17% | 22% | 27% | 32% |
| 2020 | 16% | 21% | 26% | 31% |
| 2021 | 15% | 20% | 25% | 30% |
| 2022 | 14% | 19% | 24% | 29% |
Bài tham khảo 1
The table presents the smoking rates among four age groups (18-24, 25-34, 35-44, 45-54) from 2011 to 2022.
Overview: Overall, there was a noticeable decline in smoking rates across all age groups over the 12-year period. The highest smoking rates were consistently seen in the oldest age group (45-54), while the youngest group (18-24) had the lowest rates throughout the years.
Body 1: In 2011, the smoking rates were the highest, with 25% of the 18-24 age group, 30% of the 25-34 age group, 35% of the 35-44 age group, and 40% of the 45-54 age group. This downward trend began the following year, with each age group experiencing a 1% decrease in smoking rates annually. By 2016, the rates had decreased to 20%, 25%, 30%, and 35% for the respective age groups.
Body 2: This steady decline continued through 2022. By the end of the period, the 18-24 age group had a smoking rate of 14%, while the rates for the 25-34, 35-44, and 45-54 age groups were 19%, 24%, and 29% respectively. Despite the overall reduction, the 45-54 age group remained the highest in terms of smoking rates, whereas the 18-24 group maintained the lowest rates consistently over the years.
In conclusion, the data indicates a significant reduction in smoking rates among all age groups from 2011 to 2022, with the highest percentage decrease observed in the youngest age group.
Bài tham khảo 2
Introduction
The table provides information about the percentage of smokers across four age groups (18-24, 25-34, 35-44, 45-54) from 2011 to 2022.
Overview
Overall, the data shows a consistent decline in smoking rates across all age groups over the 12-year period. The highest percentage of smokers was consistently found in the 45-54 age group, while the lowest was in the 18-24 age group.
Body 1
In 2011, the smoking rate for the 18-24 age group was 25%, which steadily decreased each year, reaching 14% by 2022. Similarly, the 25-34 age group saw a reduction from 30% in 2011 to 19% in 2022. The 35-44 age group experienced a drop from 35% to 24% over the same period.
Body 2
The 45-54 age group, which started with the highest smoking rate of 40% in 2011, also followed this downward trend, falling to 29% by 2022. Each year, the percentage of smokers in this age group decreased by approximately 1%. Despite having the highest initial rates, the decline across all age groups was fairly uniform, reflecting an overall reduction in smoking prevalence.
Bài tham khảo 3
The table illustrates the annual car sales from 2011 to 2022 in four countries: the USA, China, Japan, and Germany.
Overall, car sales in all four countries showed an upward trend over the period, with China consistently leading in total sales. Notably, the USA experienced significant fluctuations, while Japan and Germany displayed more stable, albeit slower, growth.
In the USA, car sales increased from 12.8 million in 2011 to a peak of 17.5 million in 2016, followed by a slight decline and then a recovery to 15.5 million in 2022. China saw a continuous rise in car sales, starting at 18.5 million in 2011 and reaching 27 million by 2022, marking the highest sales among the four countries each year.
Japan’s car sales grew steadily from 4.2 million in 2011 to 5 million in 2022, with a minor drop in 2020. Similarly, Germany’s car sales increased from 3.2 million in 2011 to 3.9 million in 2022, also experiencing a slight dip in 2020.
In summary, while all countries exhibited growth in car sales, China showed the most substantial increase, followed by the USA, Japan, and Germany. Despite some fluctuations, particularly in the USA, the general trend across all countries was upward.
Bài tham khảo 4
Introduction
The table provides information on the smoking rates among four different age groups (18-24, 25-34, 35-44, and 45-54) from 2011 to 2022. The data illustrates the percentage of smokers within each age group over this twelve-year period.
Overview
Overall, there is a noticeable decline in smoking rates across all age groups throughout the years. The oldest age group (45-54) consistently has the highest percentage of smokers, while the youngest age group (18-24) has the lowest.
Body 1
In 2011, the smoking rate for the 18-24 age group was 25%. This percentage gradually decreased each year, reaching 14% in 2022. Similarly, the 25-34 age group saw a decline from 30% in 2011 to 19% in 2022. The reduction in smoking rates is consistent and shows a steady downward trend across these two younger age groups.
Body 2
For the older age groups, a similar pattern of decline is observed. The 35-44 age group had a smoking rate of 35% in 2011, which decreased to 24% by 2022. The oldest age group, 45-54, started with the highest smoking rate at 40% in 2011, and this number steadily dropped to 29% in 2022. Despite the decrease, this group maintained the highest smoking rates throughout the period.
In conclusion, the table indicates a significant and consistent reduction in smoking rates across all age groups over the twelve-year span, with older individuals more likely to smoke compared to their younger counterparts.