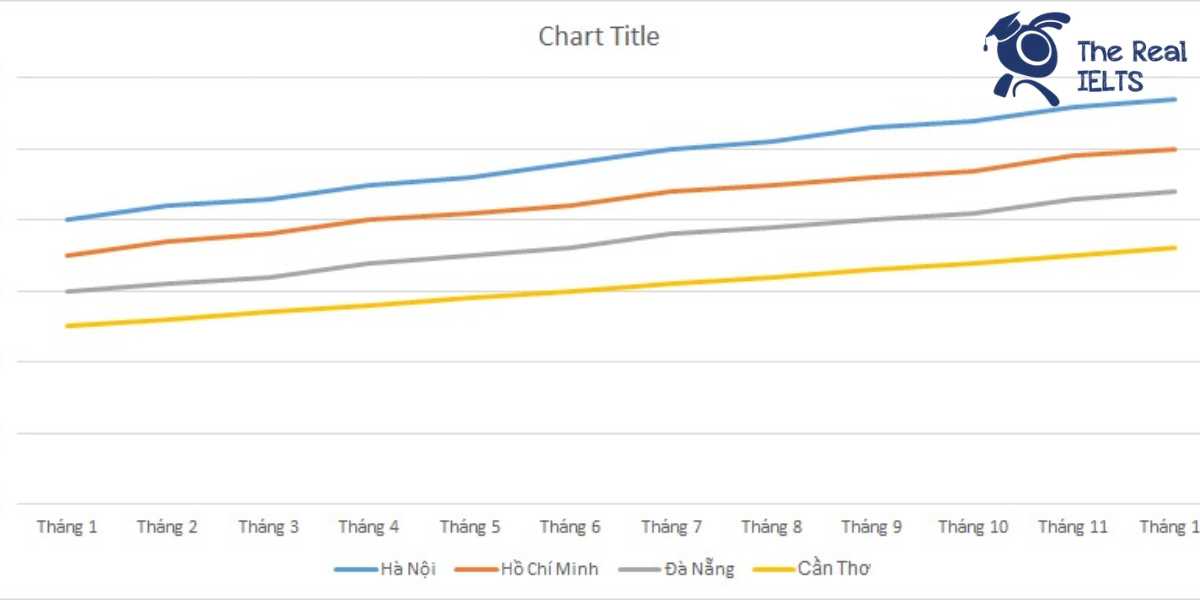
IELTS Writing Task 1 Line Graph: Biểu đồ đường thể hiện tỷ lệ sử dụng phương tiện công cộng hàng tháng của bốn thành phố trong năm 2021. Cụ thể, biểu đồ so sánh xu hướng sử dụng giữa các thành phố A, B, C, và D, từ đó đưa ra những sự thay đổi đáng kể và sự khác biệt giữa các thành phố qua từng tháng.
Bạn có thể đọc lại bài nói về Task 1 tại đây: IELTS Writing Task 1 cần lưu ý những gì?
Bạn cũng có thể đọc thêm bài viết này vì đề bài này là IELTS Writing Task 1 biểu đồ Line Graph.
IELTS Writing Task 1 Line Graph: Public Transportation
You should spent about 20 mintutes on this task
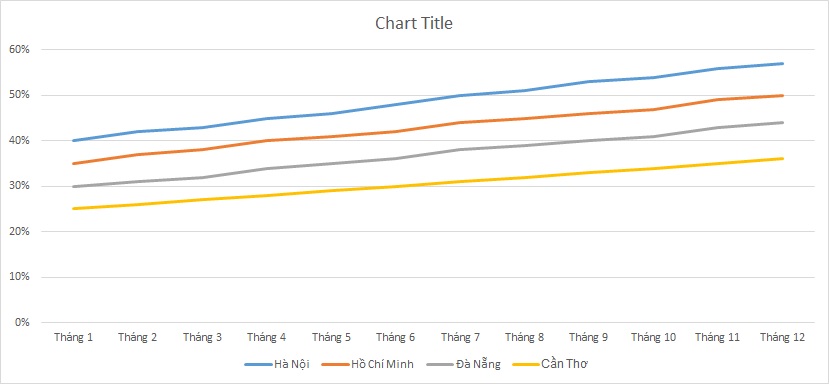
The line graph illustrates the monthly public transportation usage rates in four cities during 2021. Specifically, the graph compares the usage trends among cities A, B, C, and D, highlighting significant changes and differences between the cities throughout the months.
You should write at least 150 words.
| Tháng | Hà Nội | Hồ Chí Minh | Đà Nẵng | Cần Thơ |
| Tháng 1 | 40% | 35% | 30% | 25% |
| Tháng 2 | 42% | 37% | 31% | 26% |
| Tháng 3 | 43% | 38% | 32% | 27% |
| Tháng 4 | 45% | 40% | 34% | 28% |
| Tháng 5 | 46% | 41% | 35% | 29% |
| Tháng 6 | 48% | 42% | 36% | 30% |
| Tháng 7 | 50% | 44% | 38% | 31% |
| Tháng 8 | 51% | 45% | 39% | 32% |
| Tháng 9 | 53% | 46% | 40% | 33% |
| Tháng 10 | 54% | 47% | 41% | 34% |
| Tháng 11 | 56% | 49% | 43% | 35% |
| Tháng 12 | 57% | 50% | 44% | 36% |

Bài tham khảo 1
Introduction
The line graph illustrates the monthly percentage of public transport usage in four cities of Vietnam: Hanoi, Ho Chi Minh, Da Nang, and Can Tho during the year 2021.
Overview
Overall, there was an upward trend in the utilization of public transport in all four cities throughout the year. Hanoi consistently had the highest usage rates, while Can Tho had the lowest. Ho Chi Minh and Da Nang followed a similar pattern with moderate increases.
Body 1
In January, Hanoi had the highest public transport usage at 40%, which gradually increased each month, peaking at 57% in December. Similarly, Ho Chi Minh started at 35% and saw a steady rise, reaching 50% by the end of the year. Da Nang began with 30% in January, and its usage rate also experienced a consistent increase, culminating at 44% in December.
Body 2
Can Tho had the lowest initial percentage of public transport use at 25% in January. Like the other cities, it showed a gradual increase each month, ending the year at 36% in December. Despite being the city with the lowest usage rates, Can Tho’s growth pattern paralleled the general upward trend observed in the other cities, indicating an overall increased reliance on public transportation across the board.
In summary, all four cities displayed a consistent rise in the percentage of public transport usage throughout 2021, with Hanoi leading, followed by Ho Chi Minh, Da Nang, and Can Tho.
Bài tham khảo 2
The line graph illustrates the monthly percentage of public transportation usage in four Vietnamese cities (Hanoi, Ho Chi Minh City, Da Nang, and Can Tho) throughout the year 2021.
Overall, the proportion of public transport usage increased consistently across all four cities over the year. Notably, Hanoi had the highest usage rates, while Can Tho had the lowest.
In the first half of the year, Hanoi’s public transport usage began at 40% in January and rose steadily to 48% by June. Similarly, Ho Chi Minh City saw an increase from 35% to 42% during the same period. Da Nang and Can Tho also experienced growth, with Da Nang’s usage climbing from 30% to 36%, and Can Tho’s from 25% to 30%.
The trend continued in the latter half of the year, with Hanoi reaching 57% in December, marking the highest rate among the cities. Ho Chi Minh City’s usage grew to 50%, maintaining its position as the city with the second-highest usage. Da Nang’s figures increased to 44%, while Can Tho ended the year at 36%.
In summary, all four cities exhibited a positive trend in public transport usage throughout 2021, with Hanoi consistently leading, followed by Ho Chi Minh City, Da Nang, and Can Tho.
Bài tham khảo 3
The line graph illustrates the monthly percentage of public transport usage in four cities in Vietnam: Hanoi, Ho Chi Minh City, Da Nang, and Can Tho, throughout the year 2021.
Overall, there was a steady increase in the use of public transportation in all four cities over the year. Among these cities, Hanoi consistently had the highest percentage of public transport usage, followed by Ho Chi Minh City, Da Nang, and Can Tho, respectively.
In January, the percentage of public transport usage was 40% in Hanoi, 35% in Ho Chi Minh City, 30% in Da Nang, and 25% in Can Tho. These figures increased steadily each month. By June, the figures had risen to 48% in Hanoi, 42% in Ho Chi Minh City, 36% in Da Nang, and 30% in Can Tho.
The trend continued in the latter half of the year, with Hanoi reaching 57% by December. Similarly, Ho Chi Minh City saw a rise to 50%, Da Nang to 44%, and Can Tho to 36%. Notably, the growth rate in Hanoi was more pronounced compared to the other cities, particularly in the last quarter of the year.
In summary, the data indicates a consistent upward trend in public transportation usage across all four cities in 2021, with Hanoi leading the way in terms of the highest percentage of users throughout the year.


