IELTS Writing Task 1 yêu cầu thí sinh phân tích biểu đồ về doanh thu ngành du lịch hàng năm từ năm 2011 đến năm 2022 của bốn quốc gia. Thí sinh phải mô tả xu hướng, so sánh số liệu và nêu bật những điểm đáng chú ý. Kỹ năng phân tích và trình bày thông tin một cách logic và rõ ràng là quan trọng.
Bạn có thể đọc lại bài nói về Task 1 tại đây: IELTS Writing Task 1 cần lưu ý những gì?
Bạn cũng có thể đọc thêm bài viết này vì đề bài này là IELTS Writing Task 1 biểu đồ Line Graph.
Bạn cũng có thể Xây Dựng Lộ Trình Cá Nhân Hóa của mình tại link.
IELTS Writing Task 1 Line Graph: Tourism Revenue
You should spent about 20 mintutes on this task
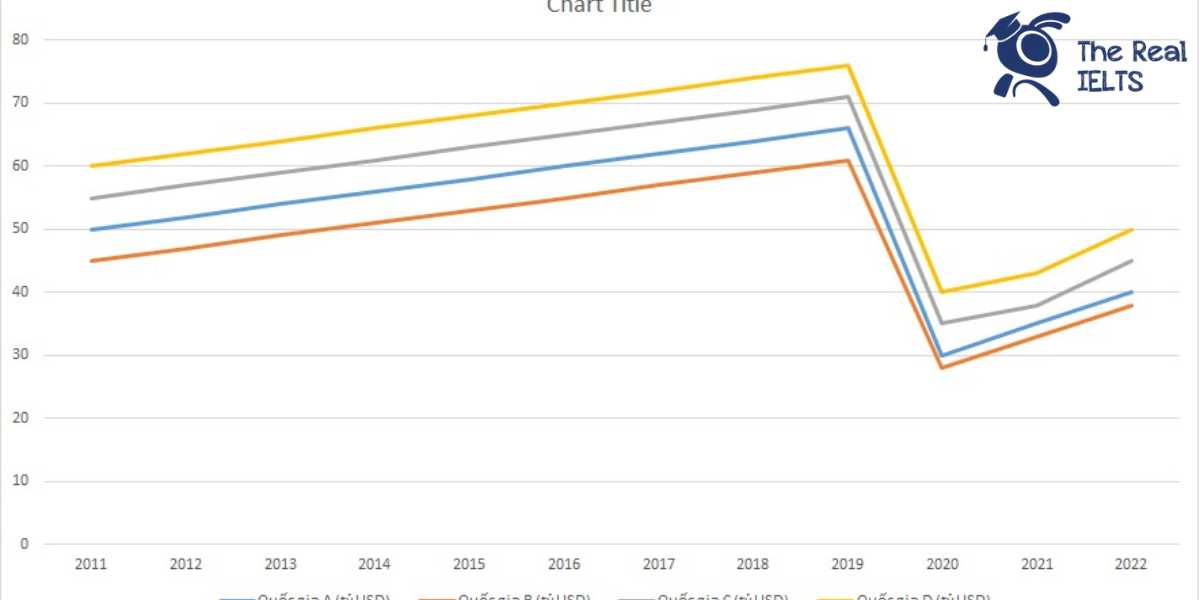
IELTS Writing Task 1 requires candidates to analyze a chart showing the annual tourism revenue from 2011 to 2022 of four countries. Candidates must describe trends, compare figures, and highlight notable points. Analytical skills and the ability to present information logically and clearly are important.
You should write at least 150 words.
| Năm | Quốc gia A (tỷ USD) | Quốc gia B (tỷ USD) | Quốc gia C (tỷ USD) | Quốc gia D (tỷ USD) |
| 2011 | 50,000 | 45,000 | 55,000 | 60,000 |
| 2012 | 52,000 | 47,000 | 57,000 | 62,000 |
| 2013 | 54,000 | 49,000 | 59,000 | 64,000 |
| 2014 | 56,000 | 51,000 | 61,000 | 66,000 |
| 2015 | 58,000 | 53,000 | 63,000 | 68,000 |
| 2016 | 60,000 | 55,000 | 65,000 | 70,000 |
| 2017 | 62,000 | 57,000 | 67,000 | 72,000 |
| 2018 | 64,000 | 59,000 | 69,000 | 74,000 |
| 2019 | 66,000 | 61,000 | 71,000 | 76,000 |
| 2020 | 30,000 | 28,000 | 35,000 | 40,000 |
| 2021 | 35,000 | 33,000 | 38,000 | 43,000 |
| 2022 | 40,000 | 38,000 | 45,000 | 50,000 |

Bài tham khảo 1
The table provides annual revenue statistics for the tourism industry in four hypothetical countries from 2011 to 2022, measured in billions of USD.
Overview:
Overall, the data reveals a consistent upward trend in tourism revenue for all four countries from 2011 to 2019, followed by a sharp decline in 2020 due to the global pandemic, with a gradual recovery observed from 2021 to 2022.
Body 1:
From 2011 to 2019, Country D consistently generated the highest revenue, starting at 60 billion USD in 2011 and rising steadily to 76 billion USD in 2019. Country A also showed significant growth, with its revenue increasing from 50 billion USD in 2011 to 66 billion USD in 2019. Similarly, Country C and Country B followed this upward trend, with their revenues growing from 55 billion USD to 71 billion USD and from 45 billion USD to 61 billion USD, respectively, during the same period.
Body 2:
The year 2020 marked a significant drop in tourism revenue for all countries, with Country D’s revenue falling to 40 billion USD, and Country A’s to 30 billion USD. Country C and Country B also experienced declines, with revenues dropping to 35 billion USD and 28 billion USD, respectively. Despite this downturn, the industry began to recover in 2021 and 2022. By 2022, Country D’s revenue had rebounded to 50 billion USD, while Country A, Country B, and Country C saw their revenues rise to 40 billion USD, 38 billion USD, and 45 billion USD, respectively, indicating a positive recovery trend post-pandemic.
Bài tham khảo 2
Introduction
The table provides data on the annual revenue generated by the tourism industry in four hypothetical countries (A, B, C, and D) from 2011 to 2022, measured in billion USD.
Overview
Overall, all four countries experienced an upward trend in tourism revenue from 2011 to 2019. However, a significant decline was observed in 2020 due to an unspecified reason, followed by a gradual recovery over the next two years.
Body 1
From 2011 to 2019, each country saw a steady increase in tourism revenue. Country A’s revenue rose from 50 billion USD in 2011 to 66 billion USD in 2019, while Country B’s revenue increased from 45 billion USD to 61 billion USD over the same period. Similarly, Country C’s revenue grew from 55 billion USD to 71 billion USD, and Country D’s revenue went up from 60 billion USD to 76 billion USD, making it the highest-earning country each year.
Body 2
In 2020, the tourism revenue in all four countries dropped sharply. Country A’s revenue fell to 30 billion USD, Country B’s to 28 billion USD, Country C’s to 35 billion USD, and Country D’s to 40 billion USD. This decline was likely due to the global impact of the COVID-19 pandemic. In 2021 and 2022, there was a gradual recovery. By 2022, the revenues for Countries A, B, C, and D had increased to 40 billion USD, 38 billion USD, 45 billion USD, and 50 billion USD, respectively, though they had not yet returned to pre-2020 levels.
Bài tham khảo 3
IELTS Writing Task 1 Example
Introduction:
The table presents the annual tourism revenue, in billions of USD, for four countries (Country A, Country B, Country C, and Country D) from 2011 to 2022.
Overview:
Overall, the tourism revenue for all four countries showed a steady increase from 2011 to 2019, followed by a significant decline in 2020. However, a gradual recovery is observed from 2021 to 2022.
Body 1:
From 2011 to 2019, all four countries experienced a consistent rise in tourism revenue. Country A’s revenue grew from $50 billion in 2011 to $66 billion in 2019. Similarly, Country B’s revenue increased from $45 billion to $61 billion, and Country C’s revenue rose from $55 billion to $71 billion. Country D had the highest revenue among the four, starting at $60 billion in 2011 and reaching $76 billion in 2019.
Body 2:
In 2020, all four countries faced a dramatic decrease in tourism revenue due to the global pandemic. Country A’s revenue dropped to $30 billion, Country B to $28 billion, Country C to $35 billion, and Country D to $40 billion. In 2021 and 2022, there was a gradual recovery. By 2022, Country A’s revenue increased to $40 billion, Country B to $38 billion, Country C to $45 billion, and Country D to $50 billion, showing signs of rebounding from the previous year’s downturn.
Bài tham khảo 4
Introduction
The table provides information about the annual revenue generated from the tourism industry in four hypothetical countries, labeled A, B, C, and D, over the period from 2011 to 2022. The values are expressed in billions of US dollars.
Overview
Overall, the tourism revenue in all four countries experienced a steady increase from 2011 to 2019, followed by a significant decline in 2020, likely due to global disruptions. The revenues started to recover gradually in 2021 and 2022.
Body 1
In 2011, Country D had the highest tourism revenue at 60 billion USD, followed by Country C with 55 billion USD. Countries A and B had revenues of 50 billion USD and 45 billion USD, respectively. Over the next eight years, all four countries saw consistent growth in tourism revenue. By 2019, Country D remained the leader with 76 billion USD, while Country C’s revenue rose to 71 billion USD. Countries A and B also showed significant increases, reaching 66 billion USD and 61 billion USD, respectively.
Body 2
The year 2020 marked a sharp decline in tourism revenue across all four countries. Country D’s revenue dropped to 40 billion USD, while Country C fell to 35 billion USD. Countries A and B experienced similar declines, with revenues decreasing to 30 billion USD and 28 billion USD, respectively. Despite this setback, the tourism sector began to recover in 2021 and 2022. By 2022, Country D’s revenue had increased to 50 billion USD, Country C to 45 billion USD, and Countries A and B to 40 billion USD and 38 billion USD, respectively.
In summary, while the tourism revenue for the four countries showed an overall upward trend from 2011 to 2019, the sector faced a major downturn in 2020 before beginning a gradual recovery in the following years.